Effects Diagram
Once the energy yield calculation has completed, the effects (gains and losses) are shown in the effects diagram.
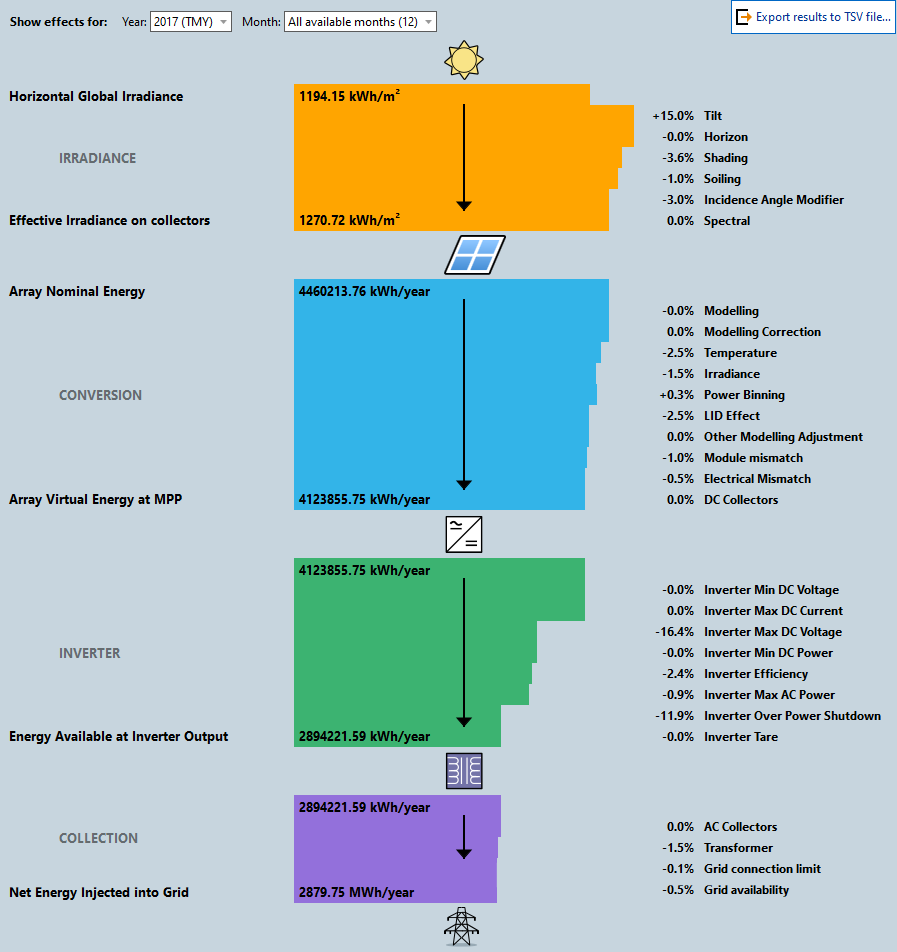
It is split into 4 sections:
| Irradiance | (sun → module) | Gains and losses of irradiance values due to tilt, horizon, shading etc. |
| Conversion | (module → inverter) | Gains and losses due to temperature, module and electrical mismatch, etc. |
| Inverter | (inverter → transformer) | Gains and losses due to inverter efficiencies, etc. |
| Collection | (transformer → grid) | Gains and losses due to transformer losses and grid availability |
The coloured sections go in/out depending on the size of the loss or gain to give you a visual representation of the values to help identify large changes.
 (click to enlarge)