Results summary
The \(\mathit{rMBE}\) and \(\mathit{rMSE}\) results aggregated over the entire data period for the sites used for SolarFarmer validation are summarised in the table below.
| Number of sites | 5 | ||
|---|---|---|---|
| Minimum | Maximum | Average | |
| rMBE (%) | - 1.0 | + 1.2 | - 0.2 |
| rRMSE (%) | 7.9 | 17.7 | 12.9 |
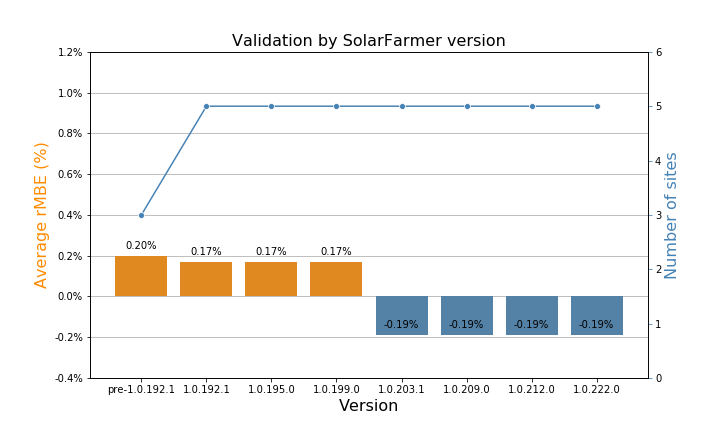
The progress of the validation by SolarFarmer version, indicating the average \(\mathit{rMBE}\) and the number of sites used, is shown in the chart below.
Note that these were all run (up to and including version 1.0.222.0) using the local calculation.