Results summary
Up to SolarFarmer version 1.0.225.0, the validation was based on the local calculation only. Except for one validation site with bifacial modules, the 3D model has been used to compare SolarFarmer results with measured site data.
The 3D API is available since version 1.0.229.0 and all validation sites have also been simulated in the cloud.
The \(\mathit{rMBE}\) and \(\mathit{rMSE}\) results aggregated over the entire data period for the sites used for SolarFarmer validation are summarised in the tables below for the local and the cloud simulations.
| Number of sites | 5 | ||
|---|---|---|---|
| Local simulations: | |||
| Minimum | Maximum | Average | |
| rMBE (%) | - 1.0 | + 1.2 | - 0.2 |
| rRMSE (%) | 7.9 | 17.7 | 12.9 |
| Cloud simulations: | |||
| Minimum | Maximum | Average | |
| rMBE (%) | - 1.6 | + 1.4 | -0.1 |
| rRMSE (%) | 7.9 | 17.8 | 12.6 |
The main change in the latest version of the calculation model used in the cloud is the addition of shading effects caused by the terrain and shading obstacles.
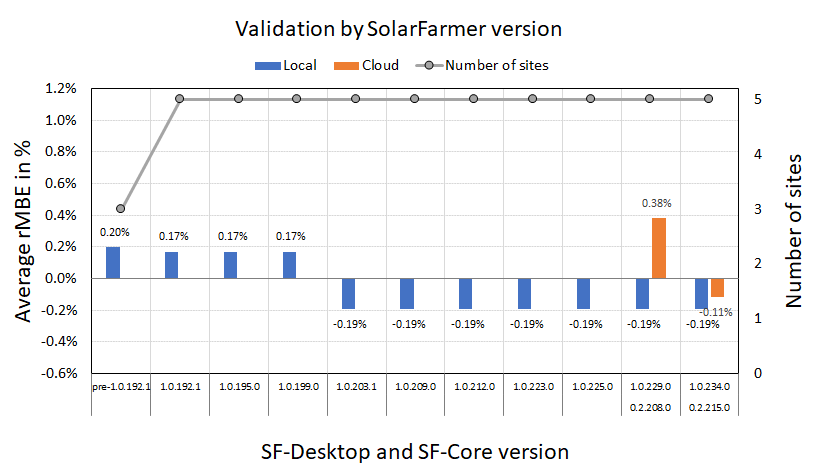
The progress of the validation by SolarFarmer version, indicating the average \(\mathit{rMBE}\) and the number of sites used, is shown in the chart below. Results for the cloud simulations are only available since SolarFarmer version 1.0.229.0.