Setup Yield Calculation
| Layout and Resources | Select the layout and resources to use in the calculation. If you have imported multiple solar resources or horizon files, you can choose only one of them here. |
| Soiling Effects | Specify soiling effects (losses due to soiling) either by month or as an overall percentage. |
| Shading Settings | Near shading radius -- the distance of terrain used for near shading effects. If you have generated horizon in SolarFarmer the near shading radius of the selected horizon data will be automatically used.
Shading target points / chunk - leave this at the default if unsure. The smaller this value the more the calculation will be broken into smaller 'chunks' (which are evaluated separately). This can help run larger simulations on smaller machines. |
| Disable Models | To speed up the calculation (though reduce its accuracy) you can disable parts of the calculation. This is useful for testing and validation purposes but generally best not to disable anything.
|
| Electrical Effects and Limits | A couple of effects (gains or losses) that are set for the whole calculation:
Grid connection limit is the limit imposed by the Plant Power Controller (PPC) that checks to make sure that the point of interconnect (POI) power doesn't exceed the specified grid limit. You can choose to enable this limit and set the value. A warning will be given if the limit you choose is less than 85% or greater than 100% of the site's total AC capacity. |
| Bin Widths | The energy yield calculation groups (bins) similar oriented racks and trackers together to optimise the calculation. The bin widths are a way to control the resolution of this binning.
The smaller the values, the fewer racks per group, which means a slightly longer calculation time. If unsure, a default of 0.5 for both are fine. Though smaller values (e.g. 0.01) lead to more accurate results. |
| Cell Temperature Model Parameters | These parameters are used to control the cell temperature model.
|
| Calculation Model Settings |
|
2D (Simple Model) vs 3D (Full Model)
There are two model options when running the energy yield calculations:
The 3D (Full) Model
This is the full shading model - the 3D location and orientation of all PV modules is considered, as well as the exact stringing layout that is used for each string. This takes longer to complete than the 2D simple model, but is the most accurate, particularly for complex terrain.For fixed-tilt sites shading is considered from other fixed-tilt racks, shading obstacles and terrain.
For single-axis tracker sites accurate geometric shading is used for row-to-row shading between trackers. Shading obstacles and terrain are used for the diffuse shading component, but not yet implemented for the beam shading component.
The 2D (Simple) Model
This is a much-simplified model based on the PVsyst sheds model. Shortcuts and assumptions are made that speed up the calculation by a large factor, but the results are not as accurate as the 3D Full Model as undulating terrain and complex shading are not taken into account.When running the 2D calculation in the cloud it calculates the average slope of each layout region and uses this sloped plane as the terrain for each layout region (they may be different). There is the option to force it to use horizontal terrain should you wish. Running 2D calculations locally always uses horizontal planes for the terrain.
Use the 2D model when first setting up a site when accuracy isn't too important. Switch to the 3D model once you are happy with all the parameters and settings.
Running Locally or in the Cloud
Calculations can be run either locally (on the PC that SolarFarmer in installed on) or in the cloud using the SolarFarmer web API.
See Calculation Feature Comparison to see some of the differences in feature support between running calculations locally and in the cloud.
Running calculations locally
Select Local computer to run the 2D or 3D calculation on the PC that SolarFarmer is installed on. The speed that the calculation runs will depend on the configuration (number of CPU cores and available RAM) of your PC. Your PC may not have sufficient memory to run some very large sites in 3D.
Running calculations in the cloud
Select Cloud to run the calculation in the cloud using the SolarFarmer web API.
Set the optional Project ID parameter (a string). This value will then appear in the 'Project ID' column in the 'Model chain runs' tab of the web API website for each calculation run in the cloud. This allows you to identify and group your related cloud calculations.
See Installation Guide for how to set up running calculations in the cloud on your machine by retrieving and setting your API access token.
All users (with an access token) will be able to run 2D calculations in the cloud. 3D calculations will currently only run for you if you have this service enabled by the SolarFarmer support team. This is currently in 'private-preview' whilst we improve the speed and reliability of 3D cloud calculations.
To determine if you have the 3D cloud calculation enabled, hover over the 'Connected to API' string and it will display the services available to you. You should see '2D calculation' and those that have it enabled will also see '3D calculation'.
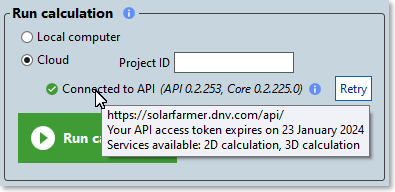
The home page of the web API website (https://solarfarmer.dnv.com/) also lists the cloud services that are available to you once you are logged in.
Write Detailed Time-Series Files
When an energy calculation is run, if selected, detailed time-series result files are written to a folder (default name "Testing") next to the workbook.
Check the 'Append current date and time to folder name' option to append the current time to the folder name, otherwise the results will be written over each time.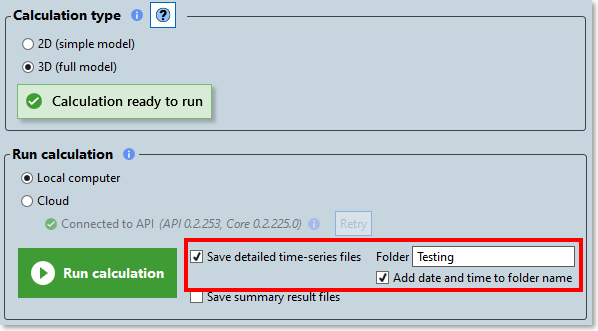
You can set these through scripting with the following settings:
Workbook.CalculationSettings.WriteOutTestingValidationFiles = true;
Workbook.CalculationSettings.ValidationFilesFolder = @"C:\temp\outputFiles";
Workbook.CalculationSettings.AppendDateToValidationFilesFolderName = true;
When running a local calculation the files written are:
| File | Description |
|---|---|
"AC Loss tree log.tsv" |
Time series - energy values |
"Irradiance log for Chunk 1.tsv" |
Time series - breakdown of irradiance at each rack/tracker grouping (one per chunk) |
"Loss tree log for Chunk 1.tsv" |
Time series - breakdown of effects diagram (one per chunk) |
"Module Performance log for Chunk 1.tsv" |
Time series - breakdown of module performance (one per chunk) |
"TrackerPositions.tsv" |
Time series - breakdown of tracker positions (only output for a single-axis tracker site layouts when calculated in 3D) |
See Time-Series Results Files for details on the contents of these files.
When running a calculation in the cloud no files are written by default. The following output files are available when you enable them via scripting:
| File | Description |
|---|---|
"PVsystFormatResults.txt" |
Output file in PVsyst format |
"TimeSeriesResults.tsv" |
Detailed output from irradiance calculation |
"Loss tree time-series.tsv" |
Breakdown of power output after adding individual effects, matching the order in the effects diagram |
To select the output files written to file, turn the export on or off in scripting by setting the corresponding workbook setting to true or false before running the calculation:
Workbook.WorkbookSettings.ReturnPvSystFormatTimeSeriesResults = true;
Workbook.WorkbookSettings.ReturnDetailedTimeSeriesResults = true;
Workbook.WorkbookSettings.ReturnLossTreeTimeSeriesResults = true;
See Cloud Time-Series Results Files for details on the contents of these files.
Write Results Files
When an energy calculation is run, if selected, result summary files are written to a folder within a folder (default name "Results") next to the workbook.
The name of the folder the files are written to is made up of the workbook name, the site layout name, and optionally the current date and time.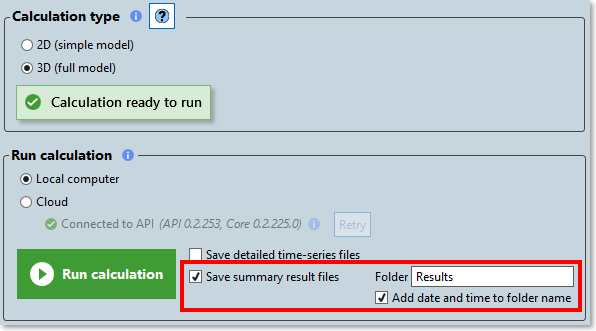
The files written are:
| File | Description |
|---|---|
"Annual Yield Results and Effects.xml" |
The annual yield results and effects - one file for each year of solar resource data. |
"Calculation Settings.xml" |
The settings used when running the calculation |
"Performance Statistics.xml" |
Performance statistics when running the calculation |
"Site Layout Statistics.xml" |
The statistics of the site layout (number of modules, inverters, etc.) |
"SolarFarmer log.txt" |
The active log file when the calculation was run (useful if any errors occur) |
Energy yield calculation report Word document |
The generated report from the calculation run |
You can set these through scripting with the following settings:
Workbook.CalculationSettings.SaveResultFiles = true;
Workbook.CalculationSettings.ResultFilesFolder = @"C:\temp\results";
Workbook.CalculationSettings.AppendDateToResultsFolderName = true;