Elevation Profile Tool
You can access the elevation profile tool functionality (see Elevation Profile Tool) from the scripting interface too.
There are two functions in the Toolbox class to use:
/// <summary>
/// Gets the elevation profile statistics (in the workbook coordinates projection).
/// </summary>
/// <param name="startPoint">The start point (in workbook coordinates).</param>
/// <param name="endPoint">The end point (in workbook coordinates).</param>
/// <param name="maxSlopeThatIsConsideredFlat">The maximum absolute slope value that
///   is considered flat (defaults to 0.0).</param>
/// <returns>An ElevationProfileStatistics object for the elevation profile along the
///   line.</returns>
ElevationProfileStatistics Toolbox.GetElevationProfileStatistics (
    IReadable2DLocation startPoint, // in the workbook local projection
    IReadable2DLocation endPoint, // in the workbook local projection
    double maxSlopeThatIsConsideredFlat = 0.0);

/// <summary>
/// Gets the elevation profile statistics for the specified points (in latitude/longitude
/// format)
/// </summary>
/// <param name="startPointInLatLon">The start point (in lat lon).</param>
/// <param name="endPointInLatLon">The end point (in lat lon).</param>
/// <param name="maxSlopeThatIsConsideredFlat">The maximum absolute slope value that is
///   considered flat (defaults to 0.0).</param>
/// <returns>An ElevationProfileStatistics object for the elevation profile along the
///   line.</returns>
ElevationProfileStatistics Toolbox.GetElevationProfileStatisticsForLatLonPoints(
    IReadable2DLocation startPointInLatLon, // in lat/lon (WGS84)
    IReadable2DLocation endPointInLatLon,  // in lat/lon (WGS84)
    double maxSlopeThatIsConsideredFlat = 0.0);
Choose the appropriate one that you have coordinates for (depending on where you get the coordinates).
The optional maxSlopeThatIsConsideredFlat argument allows you to set a slope value (usually small such as 2 or 3%) that will be considered flat. This allows you to categorize very small slopes as flat, which may be of help depending on what you're doing with the statistics (when you use the PlanViewDistanceOfFlattishUpSlopes (and the 'down' equivalent)).
Both return an ElevationProfileStatistics object. This has the following properties:
| Property | Type | Units | Description |
|---|---|---|---|
PlanViewDistance |
double | m | The plan view distance (2D distance) from the start to the end point |
PlanViewDistanceOfUpSlopes |
double | m | The plan view distance of just the up slopes that are NOT considered flat (within the MaxSlopeThatIsConsideredFlat value) |
PlanViewDistanceOfDownSlopes |
double | m | The plan view distance of just the down slopes that are NOT considered flat (within the MaxSlopeThatIsConsideredFlat value) |
PlanViewDistanceOfFlattishUpSlopes |
double | m | The plan view distance of just the up slopes that are considered flat (within the MaxSlopeThatIsConsideredFlat value) |
PlanViewDistanceOfFlattishDownSlopes |
double | m | The plan view distance of just the down slopes that are considered flat (within the MaxSlopeThatIsConsideredFlat value) |
PlanViewDistanceOfTotallyFlatSlope |
double | m | The plan view distance of totally flat slopes (slope of 0.0) |
MaxSlopeThatIsConsideredFlat |
double | m | The maximum absolute slope that is considered flat |
FollowGroundDistance |
double | m | Gets the follow-ground distance (distance along the surface of the ground - the sum of the lengths of all the sections along the profile line). |
MaxElevation |
double | m | Gets the maximum elevation |
MinElevation |
double | m | Gets the minimum elevation |
AverageElevation |
double | m | Gets the average elevation |
ElevationGain |
double | m | Gets the elevation gain (across the whole line) |
ElevationLoss |
double | m | Gets the elevation loss (across the whole line) |
NetElevationGain |
double | m | Gets the net elevation gain |
MaxUpSlope |
double | % | Gets the maximum up slope |
MaxDownSlope |
double | % | Gets the maximum down slope |
AverageUpSlope |
double | % | Gets the average up slope |
AverageDownSlope |
double | % | Gets the average down slope |
SamplePoints |
List <ElevationProfile SamplePoint> |
- | Gets the list of sample points along the elevation profile line |
There are currently 101 sample points along the line. The ElevationProfileSamplePoint class has the following properties:
| Property | Type | Units | Description |
|---|---|---|---|
DistanceFromStart |
double | m | Gets the distance from the start point of the line |
ElevationAtPoint |
double | m | Gets the elevation at point (in metres above sea level) |
SlopeAtPoint |
double | % | Gets the slope at point (percentage) |
Here is a simple example script that uses both versions (if copying this code you will have to use start and end points at locations within your workbook) and outputs a summary of each statistics object:
public void Execute()
{
    // Use start and end points in the Workbook projection (e.g. UTM)
    Location startPointInWorkbookProjection = new Location(3564093.6, 2065754.3);
    Location endPointInWorkbookProjection = new Location(3564528.2, 2065414.5);
    ElevationProfileStatistics statistics = Toolbox.GetElevationProfileStatistics(
        startPointInWorkbookProjection, endPointInWorkbookProjection);
    Toolbox.Log("--- Summary of statistics when getting the statistics from two points in the"
        + " workbook projection");
    OutputStatisticsSummary(statistics);

    // Use start and end points in latitude/longitude (WGS84) format
    // (don't forget when creating a Location, use the longitude (x) and latitude (y)
    Location startPointInLatLong = new Location(-77.752087, 38.252560);
    Location endPointInLatLong = new Location(-77.7566312, 38.254795);
    ElevationProfileStatistics statistics2 =
        Toolbox.GetElevationProfileStatisticsForLatLonPoints(
            startPointInLatLong, endPointInLatLong);
    Toolbox.Log("--- Summary of statistics when getting the statistics from two points in "
        + " latitude/longitude");
    OutputStatisticsSummary(statistics2);
}

private void OutputStatisticsSummary(ElevationProfileStatistics statistics)
{
    Toolbox.Log(string.Format(
        "Plan view distance: {0:0.##} m", statistics.PlanViewDistance));
    Toolbox.Log(string.Format("Max up slope: {0:0.##} %", statistics.MaxUpSlope));
    Toolbox.Log(string.Format("Max down slope: {0:0.##} %", statistics.MaxDownSlope));
    Toolbox.Log(string.Format("Average up slope: {0:0.##} %", statistics.AverageUpSlope));
    Toolbox.Log(string.Format(
        "Average down slope: {0:0.##} %", statistics.AverageDownSlope));
    Toolbox.Log(string.Format(
        "Net elevation gain: {0:0.##} m", statistics.NetElevationGain));
    Toolbox.Log(string.Format(
        "Point 15 slope: {0:0.##} %", statistics.SamplePoints[15].SlopeAtPoint));
    Toolbox.Log(string.Format(
        "Point 15 dist from start: {0:0.##} m",
        statistics.SamplePoints[15].DistanceFromStart));
    Toolbox.Log(string.Format(
        "Point 15 elevation: {0:0.##} m", statistics.SamplePoints[15].ElevationAtPoint));
}
And might give something similar to the following output:
INFO 2019-02-21 15:21:26,430 - --- Summary of statistics when getting the statistics from two points in the workbook projection
INFO 2019-02-21 15:21:26,520 - Plan view distance: 551.67 m
INFO 2019-02-21 15:21:26,521 - Max up slope: 17.1 %
INFO 2019-02-21 15:21:26,522 - Max down slope: -20.78 %
INFO 2019-02-21 15:21:26,522 - Average up slope: 2.83 %
INFO 2019-02-21 15:21:26,523 - Average down slope: -4.54 %
INFO 2019-02-21 15:21:26,524 - Net elevation gain: -12.03 m
INFO 2019-02-21 15:21:26,524 - Point 15 slope: -1.76 %
INFO 2019-02-21 15:21:26,525 - Point 15 dist from start: 82.75 m
INFO 2019-02-21 15:21:26,525 - Point 15 elevation: 124.33 m
INFO 2019-02-21 15:21:26,534 - --- Summary of statistics when getting the statistics from two points in latitude/longitude
INFO 2019-02-21 15:21:26,535 - Plan view distance: 468.76 m
INFO 2019-02-21 15:21:26,535 - Max up slope: 41.88 %
INFO 2019-02-21 15:21:26,536 - Max down slope: -43.68 %
INFO 2019-02-21 15:21:26,536 - Average up slope: 7.82 %
INFO 2019-02-21 15:21:26,537 - Average down slope: -5.98 %
INFO 2019-02-21 15:21:26,538 - Net elevation gain: 2.36 m
INFO 2019-02-21 15:21:26,538 - Point 15 slope: 23.33 %
INFO 2019-02-21 15:21:26,539 - Point 15 dist from start: 70.31 m\
INFO 2019-02-21 15:21:26,539 - Point 15 elevation: 106.7 m
There is also a more complicated example script in the SolarFarmer installation folder. This extracts all the line placemarks in a Google Earth .kml file, calls the elevation profile functions on each and outputs the statistics to a .tsv (Tab Separated) file.
To use this - open Google Earth (installed separately!), create some line placemarks at locations you are interested in, save the .kmz file. Then using a zip extractor tool (e.g. 7-Zip or WinZip), extract the files from the .kmz archive to another folder. There should be a "doc.kml" file inside. This will contain the line placemark details - which this script can read.
To load this sample script into SolarFarmer:
Open the script editor in SolarFarmer (using the button in the Quick Access Toolbar).
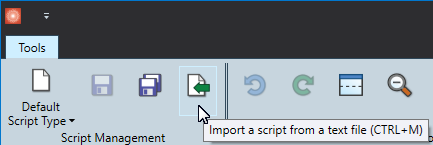
Press the 'Import' button in the script editor:
Select the following script in the installation folder of the version of SolarFarmer that you are using:
"C:\Program Files\DNV GL\<SolarFarmer install>\Scripts\ElevationProfile\ElevationProfileScript.cs"
Save the script with the suggested name (or choose another name). This will add the imported script in the current workbook.
Follow the instructions in the comment at the top of the imported script (set the path to the .kml file and the output folder).
Run the script.
The .tsv file should be created and saved to the folder that you specify.
Remember to save the workbook after you have updated the script, otherwise the script and the changes you make won't be saved for when you reopen the workbook.