The ModelChainAsync Endpoint Tutorial
Note
This tutorial assumes you have already set up a Python environment on your machine. If not, see Setting up a Python Environment for help on how to set this up.
Definition
See the ModelChainAsync Endpoint for a definition of this endpoint.
This is the endpoint to use for running 3D calculations. It runs the calculation in an asynchronous way and can handle complex, longer running calculations.
Tutorial
This tutorial will get you running the ModelChainAsync endpoint to run a 3D calculation. It's a little more complicated
to run than the ModelChain endpoint.
Important
You must have the 3D Model Chain service to use the ModelChainAsync endpoint.
You can see if you have access when you log into the Web Service website (https://solarfarmer.dnv.com) - your services are listed on the home page.
If you don't have access and you try to use the ModelChainAsync endpoint it will return an Unauthorized error.
Please email solarfarmer@dnv.com to request access if you wish to be granted access.
Usage algorithm for the ModelChainAsync endpoint:
Using this endpoint is a little more complicated than using the ModelChain endpoint (which is just a POST request
and then wait for it to return with the results).
Send a POST request to the
ModelChainAsyncendpoint to start the calculationThis POST request immediately returns, returning an Instance ID value that uniquely identifies this calculation run.
In a loop, send a polling GET request to the
ModelChainAsyncendpoint every few seconds, providing the Instance ID returned above.- This GET request immediately returns and the output includes a runtime status
- The runtime status will change from
Pending,Runningto eventuallyCompleted - The custom status in the output is set with some useful progress reporting so you can monitor how the calculation is progressing
- Then you can retrieve the calculation results from the output object once its runtime status is
Completed
The tutorial itself
We have provided some input files for the tutorial along with a python script that implements the algorithm above.
There are two lots of input files (both generated from the SolarFarmer desktop application. See Generating API input files from the SolarFarmer desktop application for how to do this yourself.)
A fixed-tilt racks site (near Matera in Italy)
4 inverters. About 1 MW AC. Racks are 12 modules long, 3 modules high. String length is 12. The 3D view (in SolarFarmer) of the fixed-tilt racks site looks like this: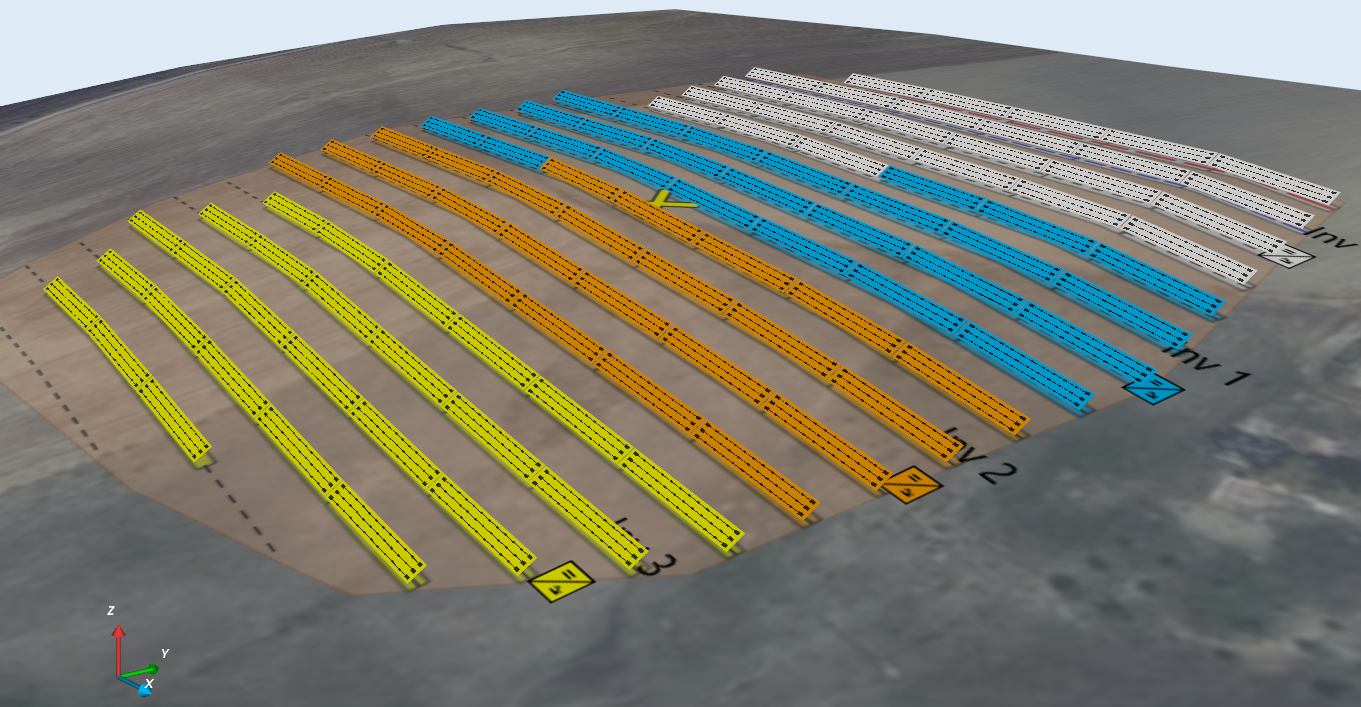
A single-axis tracker site (near Bern in Switzerland)
14 inverters. 0.84 MW AC. Trackers are 19 modules long, 2 modules high. String length is 19. The 3D view (in SolarFarmer) of the single-axis tracker site looks like this: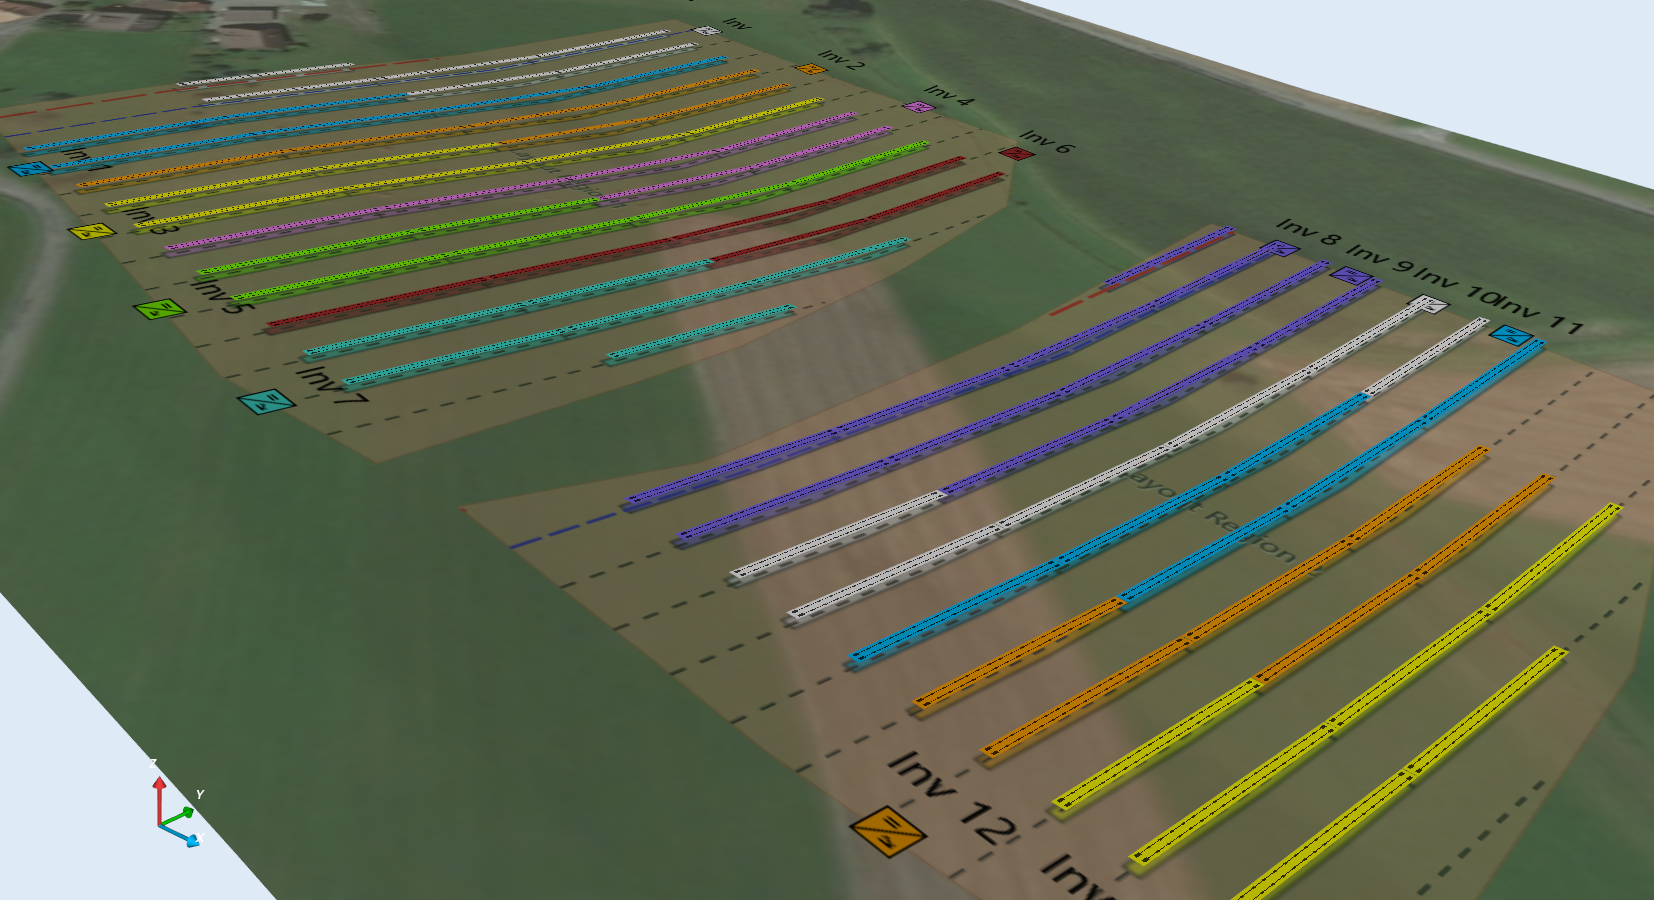
Feel free to use the Python script as a starting point for your own scripting journey using the ModelChainAsync endpoint.
Create a new empty folder (e.g. in
C:\Temp\ModelChainAsyncTutorial)Right-click the following link and select 'Save link as': ModelChainAsyncTutorial.py
- Save it (as
"ModelChainAsyncTutorial.py") into the folder you created in the step above - Replace the text 'ENTER YOUR API TOKEN HERE!!!' with your personal API token (encase it in single quotes)
- Save it (as
Right-click the following link and select 'Save link as': modelchainasync_utils.py
- Save it (as
"modelchainasync_utils.py") into the folder you created in the step above (it must be this name, as it is referenced by the other file)
- Save it (as
Right-click on one of the following input files: InputsFor3D_racks.zip or InputsFor3D_trackers.zip depending on the type of site you are interested in, and save it to the same folder.
- Unzip the contents to an
"InputsFor3D"sub-folder (it must be named this as it is referenced in the python script) - This contains the input files needed to run the
ModelChainAsyncendpoint for this tutorial
- Unzip the contents to an
Open a command prompt in the folder
Type
python ModelChainAsyncEndpointTutorial.pyand hit Return to run the scriptIt may take a few minutes to run, and you should see output similar to this:
> python ModelChainAsyncTutorial.py
Start time = 21-07-2022 16:09:49

Checking SF API version
Sending GET request to https://solarfarmer.dnv.com/latest/api/About
{'solarFarmerCoreVersion': '0.2.208.0', 'solarFarmerApiVersion': '0.2.242'}

panFiles = C:\data\PythonTutorials\ModelChainAsync Endpoint\InputsFor3D\CanadianSolar_CS6U-330M_APP.PAN
ondFiles = C:\data\PythonTutorials\ModelChainAsync Endpoint\InputsFor3D\PVP 260KW_NIST.OND
Sending POST request to https://solarfarmer.dnv.com/latest/api/modelchainasync
Instance ID returned = f24d771c933c45448dbf8f5fee3c26cb
1: Time: 0:00:02  Run status: Pending   Custom status: Custom status not received  No progress returned
2: Time: 0:00:04  Run status: Pending   Custom status: Custom status not received  No progress returned
3: Time: 0:00:06  Run status: Pending   Custom status: Custom status not received  No progress returned
4: Time: 0:00:08  Run status: Pending   Custom status: Custom status not received  No progress returned
5: Time: 0:00:10  Run status: Pending   Custom status: Custom status not received  No progress returned
6: Time: 0:00:13  Run status: Pending   Custom status: Custom status not received  No progress returned
7: Time: 0:00:15  Run status: Pending   Custom status: Custom status not received  No progress returned
8: Time: 0:00:17  Run status: Pending   Custom status: Custom status not received  No progress returned
9: Time: 0:00:19  Run status: Pending   Custom status: Custom status not received  No progress returned
10: Time: 0:00:21  Run status: Pending  Custom status: Custom status not received  No progress returned
Plant stats: 3D Racks, AC = 1.04 MW
11: Time: 0:00:23  Run status: Running  Custom status: Running 30 shading pre-processing tasks  [Shading: 0.0%, ModelChain: 0.0%, Overall: 0.0%]
12: Time: 0:00:25  Run status: Running  Custom status: Running shading pre-processing (2/30 tasks complete)  [Shading: 6.7%, ModelChain: 0.0%, Overall: 1.9%]
13: Time: 0:00:28  Run status: Running  Custom status: Running shading pre-processing (5/30 tasks complete)  [Shading: 16.7%, ModelChain: 0.0%, Overall: 4.9%]
14: Time: 0:00:30  Run status: Running  Custom status: Running shading pre-processing (7/30 tasks complete)  [Shading: 23.3%, ModelChain: 0.0%, Overall: 6.8%]
15: Time: 0:00:32  Run status: Running  Custom status: Running shading pre-processing (10/30 tasks complete)  [Shading: 33.3%, ModelChain: 0.0%, Overall: 9.7%]
16: Time: 0:00:34  Run status: Running  Custom status: Running shading pre-processing (12/30 tasks complete)  [Shading: 40.0%, ModelChain: 0.0%, Overall: 11.7%]
17: Time: 0:00:36  Run status: Running  Custom status: Running shading pre-processing (15/30 tasks complete)  [Shading: 50.0%, ModelChain: 0.0%, Overall: 14.6%]
18: Time: 0:00:38  Run status: Running  Custom status: Running shading pre-processing (17/30 tasks complete)  [Shading: 56.7%, ModelChain: 0.0%, Overall: 16.5%]
19: Time: 0:00:40  Run status: Running  Custom status: Running shading pre-processing (20/30 tasks complete)  [Shading: 66.7%, ModelChain: 0.0%, Overall: 19.4%]
20: Time: 0:00:43  Run status: Running  Custom status: Running shading pre-processing (24/30 tasks complete)  [Shading: 80.0%, ModelChain: 0.0%, Overall: 23.3%]
21: Time: 0:00:45  Run status: Running  Custom status: Running 73 model chain tasks...  [Shading: 100.0%, ModelChain: 0.0%, Overall: 29.1%]
22: Time: 0:00:47  Run status: Running  Custom status: Running model chain calculation (1/73 tasks complete)  [Shading: 100.0%, ModelChain: 1.4%, Overall: 30.1%]
23: Time: 0:00:49  Run status: Running  Custom status: Running model chain calculation (4/73 tasks complete)  [Shading: 100.0%, ModelChain: 5.5%, Overall: 33.0%]
24: Time: 0:00:51  Run status: Running  Custom status: Running model chain calculation (7/73 tasks complete)  [Shading: 100.0%, ModelChain: 9.6%, Overall: 35.9%]
25: Time: 0:00:53  Run status: Running  Custom status: Running model chain calculation (10/73 tasks complete)  [Shading: 100.0%, ModelChain: 13.7%, Overall: 38.8%]
26: Time: 0:00:55  Run status: Running  Custom status: Running model chain calculation (13/73 tasks complete)  [Shading: 100.0%, ModelChain: 17.8%, Overall: 41.7%]
27: Time: 0:00:57  Run status: Running  Custom status: Running model chain calculation (16/73 tasks complete)  [Shading: 100.0%, ModelChain: 21.9%, Overall: 44.7%]
28: Time: 0:00:59  Run status: Running  Custom status: Running model chain calculation (19/73 tasks complete)  [Shading: 100.0%, ModelChain: 26.0%, Overall: 47.6%]
29: Time: 0:01:02  Run status: Running  Custom status: Running model chain calculation (19/73 tasks complete)  [Shading: 100.0%, ModelChain: 26.0%, Overall: 47.6%]
30: Time: 0:01:04  Run status: Running  Custom status: Running model chain calculation (22/73 tasks complete)  [Shading: 100.0%, ModelChain: 30.1%, Overall: 50.5%]
31: Time: 0:01:06  Run status: Running  Custom status: Running model chain calculation (25/73 tasks complete)  [Shading: 100.0%, ModelChain: 34.2%, Overall: 53.4%]
32: Time: 0:01:08  Run status: Running  Custom status: Running model chain calculation (27/73 tasks complete)  [Shading: 100.0%, ModelChain: 37.0%, Overall: 55.3%]
33: Time: 0:01:10  Run status: Running  Custom status: Running model chain calculation (29/73 tasks complete)  [Shading: 100.0%, ModelChain: 39.7%, Overall: 57.3%]
34: Time: 0:01:12  Run status: Running  Custom status: Running model chain calculation (31/73 tasks complete)  [Shading: 100.0%, ModelChain: 42.5%, Overall: 59.2%]
35: Time: 0:01:14  Run status: Running  Custom status: Running model chain calculation (33/73 tasks complete)  [Shading: 100.0%, ModelChain: 45.2%, Overall: 61.2%]
36: Time: 0:01:17  Run status: Running  Custom status: Running model chain calculation (35/73 tasks complete)  [Shading: 100.0%, ModelChain: 47.9%, Overall: 63.1%]
37: Time: 0:01:19  Run status: Running  Custom status: Running model chain calculation (38/73 tasks complete)  [Shading: 100.0%, ModelChain: 52.1%, Overall: 66.0%]
38: Time: 0:01:21  Run status: Running  Custom status: Running model chain calculation (40/73 tasks complete)  [Shading: 100.0%, ModelChain: 54.8%, Overall: 68.0%]
39: Time: 0:01:23  Run status: Running  Custom status: Running model chain calculation (41/73 tasks complete)  [Shading: 100.0%, ModelChain: 56.2%, Overall: 68.9%]
40: Time: 0:01:25  Run status: Running  Custom status: Running model chain calculation (44/73 tasks complete)  [Shading: 100.0%, ModelChain: 60.3%, Overall: 71.8%]
41: Time: 0:01:27  Run status: Running  Custom status: Running model chain calculation (46/73 tasks complete)  [Shading: 100.0%, ModelChain: 63.0%, Overall: 73.8%]
42: Time: 0:01:29  Run status: Running  Custom status: Running model chain calculation (48/73 tasks complete)  [Shading: 100.0%, ModelChain: 65.8%, Overall: 75.7%]
43: Time: 0:01:31  Run status: Running  Custom status: Running model chain calculation (51/73 tasks complete)  [Shading: 100.0%, ModelChain: 69.9%, Overall: 78.6%]
44: Time: 0:01:34  Run status: Running  Custom status: Running model chain calculation (53/73 tasks complete)  [Shading: 100.0%, ModelChain: 72.6%, Overall: 80.6%]
45: Time: 0:01:36  Run status: Running  Custom status: Running model chain calculation (56/73 tasks complete)  [Shading: 100.0%, ModelChain: 76.7%, Overall: 83.5%]
46: Time: 0:01:38  Run status: Running  Custom status: Running model chain calculation (59/73 tasks complete)  [Shading: 100.0%, ModelChain: 80.8%, Overall: 86.4%]
47: Time: 0:01:40  Run status: Running  Custom status: Running model chain calculation (62/73 tasks complete)  [Shading: 100.0%, ModelChain: 84.9%, Overall: 89.3%]
48: Time: 0:01:42  Run status: Running  Custom status: Running model chain calculation (66/73 tasks complete)  [Shading: 100.0%, ModelChain: 90.4%, Overall: 93.2%]
49: Time: 0:01:44  Run status: Running  Custom status: Running model chain calculation (69/73 tasks complete)  [Shading: 100.0%, ModelChain: 94.5%, Overall: 96.1%]
50: Time: 0:01:46  Run status: Running  Custom status: Running model chain calculation (72/73 tasks complete)  [Shading: 100.0%, ModelChain: 98.6%, Overall: 99.0%]
51: Time: 0:01:49  Run status: Completed        Custom status: Finished calculation  [Shading: 100.0%, ModelChain: 100.0%, Overall: 100.0%]

Calculation successful!
Total time taken: 0:01:47
2D/3D = 3D calculation
Mounting type = Fixed-tilt racks
AC capacity of system = 1.04 MW
DC capacity of system = 1.23552 MW
Energy yield results:
{
 "recordCount": 8760,
 "percentComplete": 99.9999999999999,
 "averageTemperature": 15.763866338112303,
 "ghi": 1683.5117,
 "gi": 1934.9112487503653,
 "giWithHorizon": 1934.3569158297298,
 "gainOnTiltedPlane": 0.14933044347144464,
 "globalEffectiveIrradiance": 1875.1760105683427,
 "modulePower": 2150642.9367489927,
 "modulePowerAtSTC": 2317133.0132661844,
 "nominalEnergy": 2316817.4645770052,
 "pdc": 2083041.6391348962,
 "pac": 2008776.278657292,
 "performanceRatio": 0.823552198782946,
 "netEnergy": 1968.8016307120126,
 "energyYield": 1593.5004133582192
}
No pvsyst result returned
No results file returned
Total time taken = 112 seconds (0:01:51)
I ran it again a few minutes later, and got the following output:
> python ModelChainAsyncTutorial.py
Start time = 21-07-2022 16:14:37

Checking SF API version
Sending GET request to https://solarfarmer.dnv.com/latest/api/About
{'solarFarmerCoreVersion': '0.2.208.0', 'solarFarmerApiVersion': '0.2.242'}

panFiles = C:\data\PythonTutorials\ModelChainAsync Endpoint\InputsFor3D\CanadianSolar_CS6U-330M_APP.PAN
ondFiles = C:\data\PythonTutorials\ModelChainAsync Endpoint\InputsFor3D\PVP 260KW_NIST.OND
Sending POST request to https://solarfarmer.dnv.com/latest/api/modelchainasync
Instance ID returned = 6a89fed3ea0f43ca8f1f050688d83123
1: Time: 0:00:01  Run status: Pending   Custom status: Custom status not received  No progress returned
2: Time: 0:00:03  Run status: Pending   Custom status: Custom status not received  No progress returned
3: Time: 0:00:05  Run status: Pending   Custom status: Custom status not received  No progress returned
4: Time: 0:00:07  Run status: Pending   Custom status: Custom status not received  No progress returned
5: Time: 0:00:09  Run status: Pending   Custom status: Custom status not received  No progress returned
6: Time: 0:00:11  Run status: Pending   Custom status: Custom status not received  No progress returned
7: Time: 0:00:13  Run status: Pending   Custom status: Custom status not received  No progress returned
Plant stats: 3D Racks, AC = 1.04 MW
8: Time: 0:00:16  Run status: Running   Custom status: Running shading pre-processing (1/30 tasks complete)  [Shading: 3.3%, ModelChain: 0.0%, Overall: 1.0%]
9: Time: 0:00:18  Run status: Running   Custom status: Running shading pre-processing (6/30 tasks complete)  [Shading: 20.0%, ModelChain: 0.0%, Overall: 5.8%]
10: Time: 0:00:21  Run status: Running  Custom status: Running shading pre-processing (14/30 tasks complete)  [Shading: 46.7%, ModelChain: 0.0%, Overall: 13.6%]
11: Time: 0:00:23  Run status: Running  Custom status: Running shading pre-processing (26/30 tasks complete)  [Shading: 86.7%, ModelChain: 0.0%, Overall: 25.2%]
12: Time: 0:00:25  Run status: Running  Custom status: Running 73 model chain tasks...  [Shading: 100.0%, ModelChain: 0.0%, Overall: 29.1%]
13: Time: 0:00:27  Run status: Running  Custom status: Running model chain calculation (2/73 tasks complete)  [Shading: 100.0%, ModelChain: 2.7%, Overall: 31.1%]
14: Time: 0:00:29  Run status: Running  Custom status: Running model chain calculation (11/73 tasks complete)  [Shading: 100.0%, ModelChain: 15.1%, Overall: 39.8%]
15: Time: 0:00:31  Run status: Running  Custom status: Running model chain calculation (20/73 tasks complete)  [Shading: 100.0%, ModelChain: 27.4%, Overall: 48.5%]
16: Time: 0:00:34  Run status: Running  Custom status: Running model chain calculation (30/73 tasks complete)  [Shading: 100.0%, ModelChain: 41.1%, Overall: 58.3%]
17: Time: 0:00:36  Run status: Running  Custom status: Running model chain calculation (43/73 tasks complete)  [Shading: 100.0%, ModelChain: 58.9%, Overall: 70.9%]
18: Time: 0:00:38  Run status: Running  Custom status: Running model chain calculation (62/73 tasks complete)  [Shading: 100.0%, ModelChain: 84.9%, Overall: 89.3%]
19: Time: 0:00:40  Run status: Completed        Custom status: Finished calculation  [Shading: 100.0%, ModelChain: 100.0%, Overall: 100.0%]

Calculation successful!
Total time taken: 0:00:40
2D/3D = 3D calculation
Mounting type = Fixed-tilt racks
AC capacity of system = 1.04 MW
DC capacity of system = 1.23552 MW
Energy yield results:
{
 "recordCount": 8760,
 "percentComplete": 99.9999999999999,
 "averageTemperature": 15.763866338112303,
 "ghi": 1683.5117,
 "gi": 1934.9112487503653,
 "giWithHorizon": 1934.35691582973,
 "gainOnTiltedPlane": 0.14933044347144464,
 "globalEffectiveIrradiance": 1875.1760105683427,
 "modulePower": 2150642.9367489927,
 "modulePowerAtSTC": 2317133.0132661844,
 "nominalEnergy": 2316817.4645770052,
 "pdc": 2083041.6391348962,
 "pac": 2008776.278657292,
 "performanceRatio": 0.823552198782946,
 "netEnergy": 1968.8016307120126,
 "energyYield": 1593.5004133582192
}
No pvsyst result returned
No results file returned
Total time taken = 43 seconds (0:00:42)
You can see that the second time it was run it was much quicker to complete. This is because of the way the asynchronous calculation is implemented in the cloud. See Why calculation times may vary for an explanation.
Handling errors
See the Handling errors section in the ModelChain Tutorial for more details and some examples of handling errors returned by the calculation endpoint.