Setup Yield Calculation
| Layout and Resources | Select the layout and resources to use in the calculation. If you have imported multiple solar resources or horizon files, you can choose only one of them here. |
| Soiling Effects | Specify soiling effects (losses due to soiling) either by month or as an overall percentage. |
| Shading Settings | Near shading radius -- the distance of terrain used for near shading effects. If you have generated horizon in SolarFarmer the near shading radius of the selected horizon data will be automatically used.
Shading target points / chunk - leave this at the default if unsure. The smaller this value the more the calculation will be broken into smaller 'chunks' (which are evaluated separately). This can help run larger simulations on smaller machines. |
| Disable Models | To speed up the calculation (though reduce its accuracy) you can disable parts of the calculation. This is useful for testing and validation purposes but generally best not to disable anything.
|
| Electrical Effects | A couple of effects (gains or losses) that are set for the whole calculation:
|
| Bin Widths | The energy yield calculation groups (bins) similar oriented racks and trackers together to optimise the calculation. The bin widths are a way to control the resolution of this binning.
The smaller the values, the fewer racks per group, which means a slightly longer calculation time. If unsure, a default of 0.5 for both are fine. Though smaller values (e.g. 0.01) lead to more accurate results. |
| Cell Temperature Model Parameters | These parameters are used to control the cell temperature model.
|
| Diffuse Transposition Model | Choose either the Perez or Hay model for the diffuse transposition model (the calculation of the incident irradiance on a tilted plane from the horizontal irradiance data). |
| Emulate PVsyst | Comparisons of results from PVsyst and SolarFarmer models have revealed a couple of areas where we think we know what PVsyst is doing but don't agree with.
Validating SolarFarmer against PVsyst is desirable, but if we choose slightly different models or behaviour to how PVsyst works, the validation against PVsyst becomes difficult. We cannot change PVsyst's behaviour but also do not wish to adopt calculations in SolarFarmer that we consider incorrect. Check this box to choose PVsyst behaviour for the calculation areas where SolarFarmer and PVsyst differ slightly. Note this is currently not compatible with our bifacial calculation; you cannot use this setting if you have bifacial modules in the layout and you haven't disabled the bifacial model. |
2D (Simple Model) vs 3D (Full Model)
There are two model options when running the energy yield calculations:
The 3D (Full) Model
This is the full shading model. The location and orientation of all PV modules is considered, along with accurate shading from other modules, shading obstacles and terrain. This takes longer to complete than the 2D Simple Model but is the most accurate and is the recommended model to use, particularly for complex terrain.The 2D (Simple) Model
This is a much-simplified model based on the PVsyst sheds model. Shortcuts and assumptions are made that speed up the calculation by a large factor, but the results are not as accurate as the 3D Full Model, as undulating terrain and complex shading are not taken into account. It assumes a horizontal terrain. Use this when first setting up a site when accuracy isn't too important. Switch to the Full Model once you are happy with all the parameters and settings.
Running Locally or in the Cloud
Currently you must run the calculation on your local PC. This is limited to your PC's specifications.
Work is underway so that you can run your calculations on a secure DNV GL SolarFarmer Cloud, freeing up your PC and using the parallel power of the cloud. This should be available some time in 2021.
Write Detailed Time-Series Files
When an energy calculation is run, if selected, detailed time-series result files are written to a folder (default name "Testing") next to the workbook.
Check the 'Append current date and time to folder name' option to append the current time to the folder name, otherwise the results will be written over each time.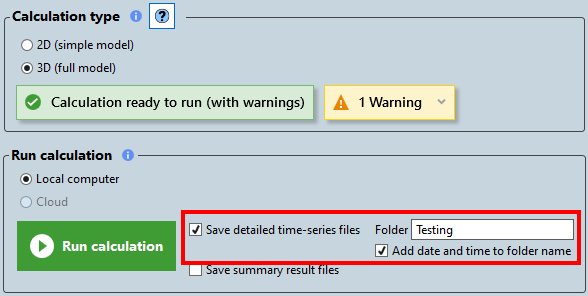
The files written are:
| File | Description |
|---|---|
"AC Loss tree log.tsv" |
Time series - energy values |
"Irradiance log for Chunk 1.tsv" |
Time series - breakdown of irradiance at each rack/tracker grouping (one per chunk) |
"Loss tree log for Chunk 1.tsv" |
Time series - breakdown of effects diagram (one per chunk) |
"Module Performance log for Chunk 1.tsv" |
Time series - breakdown of module performance (one per chunk) |
"TrackerPositions.tsv" |
Time series - breakdown of tracker positions (only output for a single-axis tracker site layouts) |
See Time-Series Results Files for details on the contents of these files.
Write Results Files
When an energy calculation is run, if selected, result summary files are written to a folder within a folder (default name "Results") next to the workbook.
The name of the folder the files are written to is made up of the workbook name, the site layout name, and optionally the current date and time.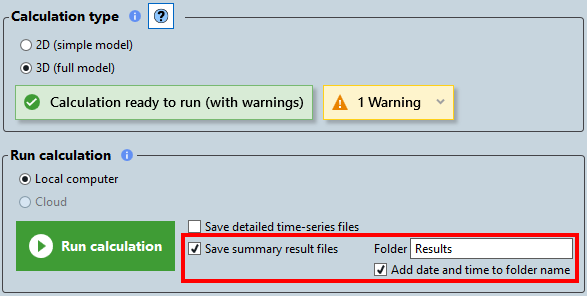
The files written are:
| File | Description |
|---|---|
"Annual Yield Results and Effects.xml" |
The annual yield results and effects - one file for each year of solar resource data. |
"Calculation Settings.xml" |
The settings used when running the calculation |
"Performance Statistics.xml" |
Performance statistics when running the calculation |
"Site Layout Statistics.xml" |
The statitics of the site layout (number of modules, inverters, etc.) |
"SolarFarmer log.txt" |
The active log file when the calculation was run (useful if any errors occur) |
Energy yield calculation report Word document |
The generated report from the calculation run |