
WindFarmer 1.5.4 (2024-02-28)
This release corrects some bugs and instabilities uncovered after our performance improvements released in version 1.5.3.
- Occasional instabilities on loading workbooks and switching scenarios have been addressed
- The elevation layer no longer occasionally disappears when zooming in and out and switching scenarios
- Navigation performance in a workbook with many turbine types has been improved
- Fixed implausibly small energy yield results for some new workbooks due to an issue with the air density calculation inialisation
- It is now possible to delete duplicate target wind resources introduced by loading twice through scripting
- Turbines that have curtailment rules defined can now be deleted without causing problems
- The shear section in the EPA report now includes all instances of reference wind direction and time series for extrapolation
- (Electrical) Current is now a recognised timeseries measurement type
WindFarmer 1.5.3 (2024-01-29)
In release 1.5.3 we have made a significant improvement to the performance of the user interface with large numbers of turbines. Some important bugs have also been addressed.
Large wind farms: map performance improvement
Thanks to a redesign of the map turbine layer, you can now pan and zoom the map view in large workbooks containing thousands of turbines with vastly increased performance and redraw speed.
Adding large numbers of turbines using the layout generation tools, and switching between task views are now also many times faster.
Usability improvements
The Turbine Types view now has much improved scrolling to aid use on smaller screens.
Legacy advanced settings for the classic energy calculation are now hidden when the new energy calculation is selected to avoid confusion.
Bugs fixed
Forestry : Fix for forestry displacement height calculation
Reporting: Improved stability when exporting TSV files with missing net energy calculation inputs
Net energy:
- Net energy results now available in upgraded workbooks
- Improved error messages when efficiency standard deviation is zero and the mean matches the low truncation
Elevation grid: Reduced memory usage of the slopes layer for large elevation grids
Scripting:
- Correct geographical checks when importing external wind resources in scripting
- Noise results are once again available in scripting
WindFarmer: Analyst 1.5.2.1 - hotfix (2023-11-17)
This hotfix release contains some critical bug fixes.
Bugs fixed
Net energy results, total losses and project uncertainties: Correct reporting of total losses and project uncertainties following the introduction of custom-defined overall energy uncertainties. In the json report past uncertainties were being filtered out. Note these were only issues in reporting not in the calculation, no changes to the Net or Gross energy distribution results.
Flow model: Fix "object reference not set to instance of an object" when running the flow model in cases when the point wind resource at the mast had a height of 0 m.
WindFarmer: Analyst 1.5.2 (2023-11-03)
In this release, we have improved our support for indicative energy assessments and preliminary studies by enabling importing of wind resources and calculation of net energy yield without first requiring a measurement mast.
We have also made some productivity enhancements by providing a tool to add a large number of turbines in one step in a close-packed arrangement, increasing the speed of switching between scenarios, and improving the performance of navigation between tasks in the Flow chapter.
Indicative energy assessments with no onsite measurements
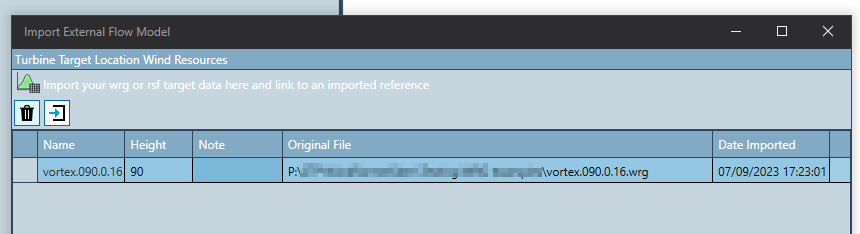
External wind resource grid import without measurement sites
Wind resources grids may now be imported directly, without the need to import a point WRG at a mast location.
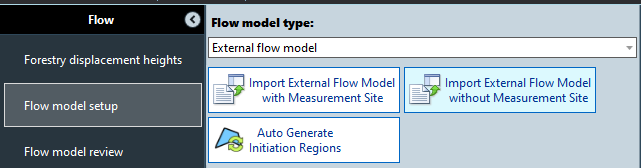
Flow model review
All loaded and calculated target wind resource grids can now be reviewed in a table within the flow model review task. Wind resources that are no longer required may also be deleted.
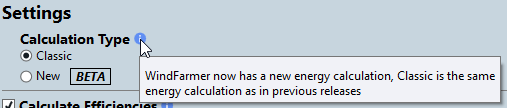
New energy calculation without the association method
You may now calculate the waked annual energy production with the association method turned off in the new energy calculation. This enables the generation of an overall sensitivity curve and calculation of net energy, and also flow calibration, when no wind measurement data is available. With this improvement, we have made the new energy calculation the default selection.
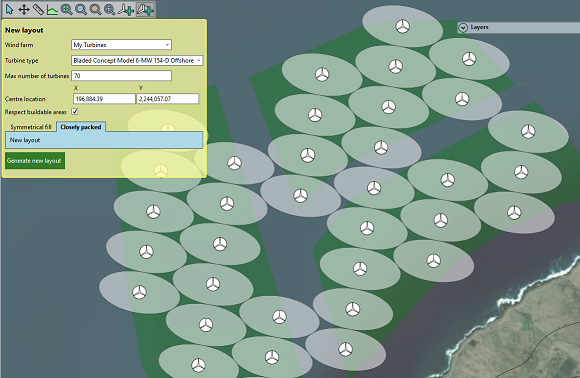
Layout tools
The new Closely Packed option in the turbine layout tool provides a way of adding a large number of turbines as close together as possible in a regular layout while respecting minimum-separation distances and, optionally, the buildable area. The layout will be centred on the selected location.
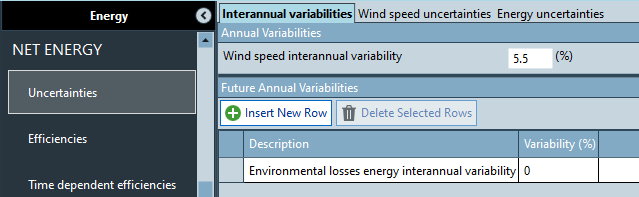
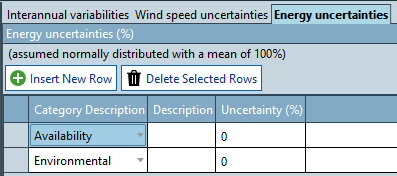
Uncertainties
We have expanded the uncertainties model to include custom-defined future annual variabilities and custom-defined overall energy uncertainties.
Performance improvements
The performance of switching between layout scenarios and navigating to flow model tasks has been improved, for an enhanced user experience and improved productivity.
Bugs fixed
WF5 conversion: Shadow Flicker receptors, Noise receptor heights, Noise and non-default turbine constraints now imported when converting a legacy WindFarmer5 workbook.
Data cleaner: Improvements to scatter plot point visibility when graphics hardware acceleration is enabled
Flow model: Fixed: crash when simple flow model type is used for flow model calculation from scripting
Symmetric layout generator: Improvements interpreting buildable area regions with holes
Monte Carlo net energy: Fixed: crash running Monte Carlo net energy after computing power time series curtailments from scripting
Curtailment strategies: Fixed: crash when copying data from the curtailment strategies table
Time offsets: Fixed: issue in some workbooks where it was not possible to add time offsets on measurement sites
Internal python scripting: restored installation of standard libraries
Known issues
The Wind flow adjustment view and map do not yet show the correct mean windspeeds when the association method is disabled
Flow calibrations including curtailment impacts that are calculated using power time series combined, with a frequency domain AEP calculation using the non-association method, has not yet been implemented.
When a wind resource is deleted, the wind flow visualisation does not update
WindFarmer: Analyst 1.5.1.1 - hotfix (2023-07-12)
This hotfix release contains some critical bug fixes.
Bugs fixed
Turbine types: "Tower position offset" value is not editable
Wind farm results: Energy results displaying incorrect unit (showing MWh instead of GWh)
Net energy results, Total Losses: The total losses value is now calculated correctly from the product of the means of the simulated efficiency distributions output from the Monte Carlo simulation. Previously the total losses were calculated from the product of the user-input distribution means. If there are asymmetric truncations these two values can diverge.
WindFarmer: Analyst 1.5.1 (2023-06-23)
This release contains mainly bug fixes and minor improvements across a range of areas.
Noise improvements
When a noise grid is calculated, you now have the option of displaying contours. Also, noise and shadow flicker receptor heights are now correctly read from workbooks saved in, and upgraded from, version 1.4.0.
Bugs fixed
Project setup wizard: planar units string is now in plain language
Wind farm project import: Measurement sites from imported wind farms are now available in wind speed uncertainty setup
Wind analysis:
Long term adjustment - fixed error on attempting to copy the included selection to another mast when there is no other mast
Data cleaner - with mast data from Resource Panorama, exclusions which have no reason defined are now displayed correctly
Hub height time series - the “Optional speedup” column has been removed as it is not used
16-sector wind climate support:
- Speed-up bin centres are now correctly reported
- Wind rose plots have sectors centred at the correct directions for 16-sector FDs
- Frequency distributions with 16 direction sectors may now be generated in wind climate Manual Setup tool
- Power time series calculation may now be run with 16-sector WTI turbulence inputs
Flow model:
- Improved error message when WAsP suite installation is not in the expected location
- Changing a measurement site type no longer changes the initiation mast for flow model initiation regions
- A warning has been added to say the flow grid calculation does not consider displacement heights
Wind farm layout design:
- A default turbine type is now set for placing new turbines, on adding a turbine type
- Fixed crash on navigating to Design chapter after deleting a turbine type used in a layout
Optimiser:
Onshore irregular optimiser
- Fixed the default Cost Benefit script so that it compiles and runs correctly
- Updated display of iterations so that optimisation does not appear to complete before the max or fruitless iteration limit is hit
General optimiser improvements
- The layout name and iteration count now match
- Default value for max iterations has been increased to 10,000
- Layers are now correctly re-enabled after an optimiser run
- Fixed issues with receptor setbacks in optimisation
- Optimiser now recognises correctly when buildable area is fully covered by flow data
Shadow flicker: UTC Offset (hours) setting is now taken from the time zone setting in the site location task
Energy:
- Added warning when running Classic FD AEP calculation with curtailment rules that use turbine mode switch
- Fixed Blockage model failure with TAB file containing 17 speed bins
- Fixed Blockage model failure in Power Time Series with power curves that do not have monotonically increasing windspeed values
Reporting: Monthly wind rose plot data are now reported on the correct month (previously offset by 1)
UI: Fixed visibility issues apparent for low resolution monitors so that all settings can be seen, including those in:
- Shear model settings
- Shear plots
- Turbine Interactions
- Power time series
- Direction reconstruction, reconstruction summary
- Parallel measurement combination, reconstruction summary
- Speed reconstruction, reconstruction summary
- Long Term Adjustment , auto-setup window
- Flow model review
- Air Density
- Design Turbulence
- Layout optimiser settings
Scripting:
- Allow adding/removing custom uncertainty and efficiency categories in scripting
- Added method to export Noise grids
- Added setting of IntermediaryResultsFolderPath for Noise
- Added setting of Exclusion/Inclusion region setbacks
WindFarmer: Analyst 1.5.0 (2023-05-19)
In release 1.5.0 we have added a new layout optimisation algorithm, suitable for onshore wind farms where irregular layouts are acceptable.
All our optimisation algorithms now respect setback values specified for boundaries and also for environmental receptor locations. In addition it is possible to respect noise constraints (defined with the Environment module) in optimisations.
Furthermore, this release includes access to a library of turbine concept models and improvements to the net energy and uncertainty energy calculation.
Layout constraints for optimisation
Boundary setbacks: fixed setbacks may be applied to both inclusion and exclusion regions to reduce the buildable area. These setbacks are respected by all the layout optimiser algorithms and also the gridded turbine layout generator.
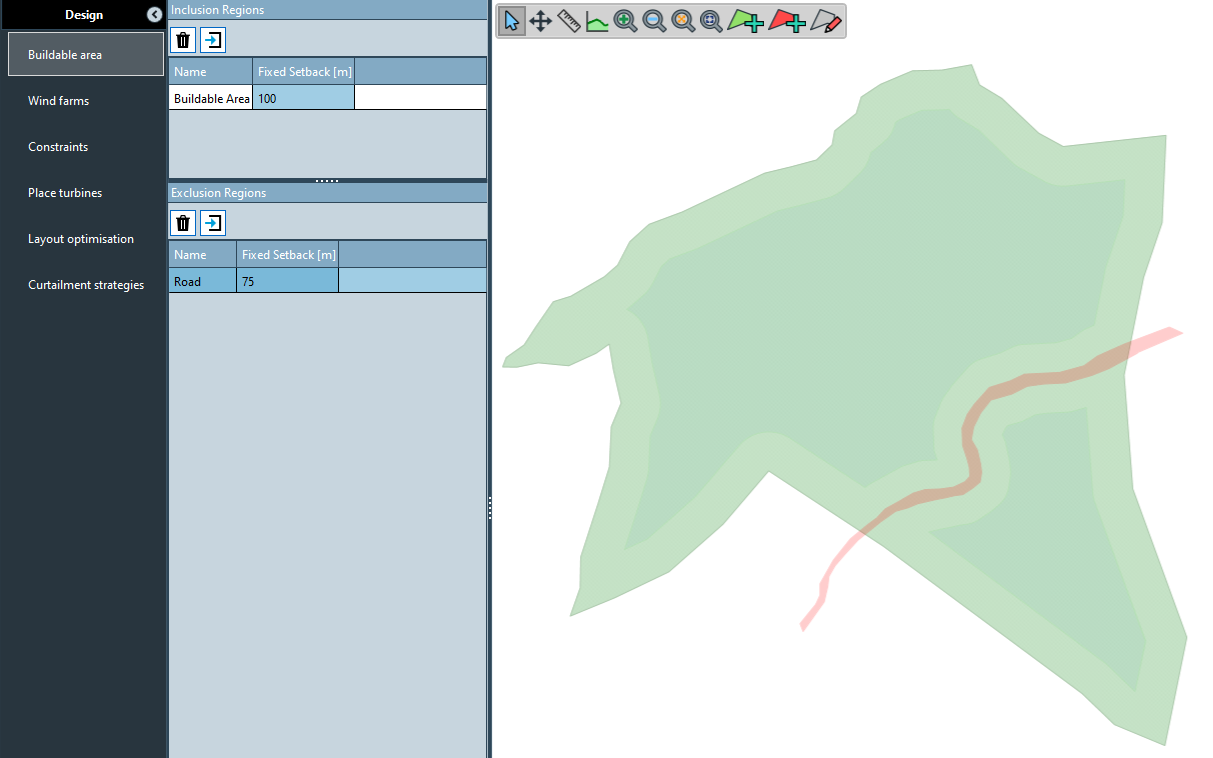
Environmental Receptor setbacks: fixed setbacks may be applied to environmental receptor locations. No turbines will be placed within this distance of the receptor during layout optimisation.
Noise limits: when activated in the constraints task, the optimiser will calculate the noise prediction at each receptor and if limits are exceeded, that layout will be rejected. (Note: this constraint does not currently apply to the symmetrical layout optimiser algorithm).
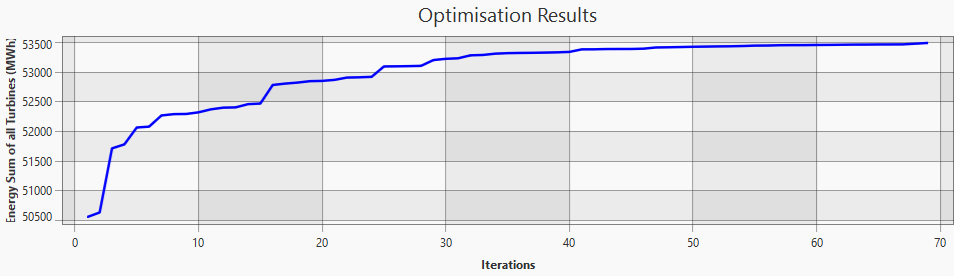
Irregular onshore optimiser algorithm
This optimiser algorithm actively searches first for locations where the gross yield is higher, while retaining a random element that helps to prevent getting stuck in a local maximum.
The algorithm is based on the optimiser in WindFarmer 5.3 and performs much better than current random optimisers when there is a significant variation in the wind resource across the site.
Monte Carlo Net Energy calculation improvements
Calculate an upflow efficiency automatically when you have gridded elevations in your workbook. The upflow efficiency factor accounts for the change in power produced by turbines situated in locations with significant vertical wind speed components, e.g. on or near a steep slope.
A new environmental loss inter-annual variability on energy allows you to describe the year-to-year variation in environmental loss factors in the Monte Carlo Net Energy model. This can be important in regions with heavy icing.
Override calculated efficiencies by manually entering your desired efficiency factor to replace any of WindFarmer's calculated efficiencies, should you need to modify the WindFarmer result by some factor or use a result from your own external model. The override can also be performed in scripting to enable your logic to be applied to efficiency derivation.
Also: To remove truncations, and blank input cells, you no longer have to type NaN - just delete the cell contents.
Blockage loss now applied to power time series calculations.
The Blockage Effect Estimation Tool has previously only been applied when calculating frequency domain annual energy predictions and it ran as a standalone calculation to derive a loss. We implemented a way to apply the same calculation flow-case by flow-case so that when you select “Apply wind farm blockage model” in the turbine interaction settings WindFarmer now considers blockage in the power time series calculation.
Reference turbine library: Bladed Concept Models
DNV have developed a set of concept models for the purpose of representing a full, indicative range of the current state-of-the-art of modern WTG models across onshore and offshore applications. The models have been produced in DNV's Bladed wind turbine design software using publicly accessible data and data supplied by customers (dimensions, mass, frequencies, operational parameters) and are not an exact match of any specific models built by turbine OEMs. Power curves and thrust coefficient have been calculated for a range of windspeeds with 10% turbulence for use in WindFarmer: Analyst and are included in the turbine library.
Other improvements
- The heights of noise and shadow flicker receptors can now be set independently
- Improved error message when loading WRG files containing multiple heights or incorrectly ordered points
Bugs fixed
- Fixed a crash that sometimes occurs when navigating through the UI when the optimiser is running
- Fixed an issue whereby the buildable area derived from a set of complex boundaries with holes in is incorrectly flagged as invalid
WindFarmer: Analyst 1.4.0 (2023-02-21)
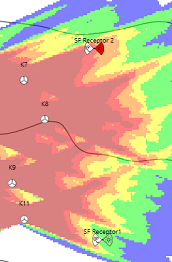
The Environment module is now available to purchase. In this release we have improved the noise and shadow flicker modelling abilities released in Beta within versions 1.3.6 and 1.3.7. The main Environment module features and recent improvements are listed here. See releases 1.3.6 and 1.3.7 and the User Guide for more details
Environment Module feature summary
| Features | Noise | Shadow flicker |
|---|---|---|
| Define receptor locations | ✔ | ✔ |
| Define limits at receptors | ✔ | ✔ |
| Define model parameters | ✔ | ✔ |
| Calculate resultant value at receptors | ✔ | ✔ |
| Calculate for different windspeeds | ✔ | - |
| Calculate for specific rotor orientation | - | ✔ |
| Predict impacts considering wind direction and cloud cover | - | ✔ with automation module |
| Indicate on map where limits are exceeded | ✔ | ✔ |
| Indicate graphically which receptors are under/close to/over limits | ✔ | - |
| Calculate and display grid | ✔ | ✔ |
| Export grid | ✔ | ✔ |
| Export contours | ✔ | ✔ |
| export intermediate inputs and results as JSON | ✔ | - |
| Export just results tables as TSV | ✔ | - |
| Report receptor results summary | ✔ | ✔ |
| Report receptor results breakdown by windspeed | ✔ | - |
| Report receptor results breakdown by turbine contribution | ✔ | ✔ |
| Report timeseries results | - | ✔ |
| Consider receptor limits as constraint in optimisations | Available from v1.5 | - |
Noise Improvements
The noise results export feature now includes the (worst case) noise output at receptors broken down by noise source, providing a useful input into the design of noise curtailment strategies.
The extents of the noise grid may be controlled by specifying the minimum noise level of interest.
Noise map contours are now exported at 2dB intervals (select export as *.shp file).
Input settings are no longer reported if the calculation has not been run.
Minor changes have been made to settings names and UI appearance to make them more understandable.
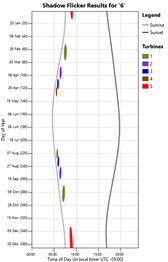
Shadow Flicker Improvements
Validation messages are displayed if the input settings are set incorrectly before a calculation is run.
You can now cancel the calculation after it has started, in case you notice you have not adjusted a setting correctly.
The scale of the legend for the grid layer has been adjusted so that the colour variation is more visible.
Minor adjustments have been made to the "Flicker periods" TSV report (a daily summary by turbine for each receeptor, previously named "Receptor results over time").
General
Receptor map icon display improvements: turning off the noise or shadow flicker sublayer now causes the relevant part of the icon to be hidden
Naming of TSV report files has been made more consistent by changing all file names to sentence case capitalisation, e.g.:
  Noise At Receptors Over Windspeed ⇨ Noise at receptors over windspeed
  Noise Turbine Contributions  ⇨   Noise turbine contributions

  Efficiency Uncertainties.tsv ⇨   Efficiency_uncertainties.tsv
  Project_Uncertainties.tsv    ⇨   Project_uncertainties
  Turbine Results.tsv          ⇨   Turbine results.tsv
  Wind Climate.tsv             ⇨   Wind climate.tsv
  Wind Farms.tsv               ⇨   Wind farms.tsv

  ...etc
In addition, some of the reports for Noise and Shadow flicker have been updated for clarity:
  Noise
      Noise Inputs.tsv               ⇨   Noise summary.tsv

  Shadow flicker
      Receptor Summary.tsv           ⇨   Flicker summary.tsv
      Receptor results over time.tsv ⇨   Flicker periods.tsv
      Time series.tsv                ⇨   Flicker timeseries.tsv
Other
- JSON results exported extended to included Net and Gross energy exceedance results for user specified year ranges.
WindFarmer: Analyst 1.3.7.1 (18/01/2023)
This release contains a new JSON report data export, some bug fixes, and improvements to energy modelling, particularly for projects using turbines with "storm control" or "high wind ride through" features.
New JSON results report
A new single-file JSON data report has been introduced for easy reading of WindFarmer results into external programs or scripts. This report contains the data reported in a DNV EPA that is available in a WindFarmer: Analyst project. The report may be exported using a simple scripting method described here.
Improvement to air density corrections for turbines with storm control policies
Some wind turbines have a high wind speed shutdown policy with a "storm control" or "high wind ride through" feature. For these turbines the turbine de-rates at high wind speeds near cut-out to enable a smoother transition to a non-operational state. To improve the modelling of these graduated high wind shutdown polices, the air density correction is no longer applied to pitch-controlled turbines operating above the wind speed where they reach rated power.
This change has no impact for wind turbines where the production is constant once you reach rated power.
This improvement has been applied to the New energy calculation only. Across a sample of 30 projects we observed a maximum change in AEP of 0.17% due to this change for a project with a large air density correction of > 0.2 kg\m3, whereas all other projects all experienced differences of < 0.05%.
A bug with negligible impacts was also fixed in the interpolation of power curves for turbines with "storm control". This issue was introduced to the new energy calculation in version 1.2.3. The bug/fix was observed to have a maximum impact of 0.01% AEP for same project described above.
In summary, changes in numbers will only be observed in 1.3.7.1 for turbines with storm control. Greater impacts will be observed where the air density correction is greater. We recommend using power curves closer to the site air density to reduce uncertainties and using the multi-air density turbine type feature so that the best data is selected automatically by the energy calculation for each turbine.
Bug fixes
WAsP 12.8 compatibility fixed
We fixed an incompatibility between the recent WAsP version 12.8 release and WindFarmer: Analyst to ensure that you can automate WAsP 12 wind flow calculations within WindFarmer.
Monte Carlo Net Energy fixed where sensitivity curve has negative slope
Some projects can have wind-speed-perturbation to energy-perturbation sensitivity curves with a negative slope at high positive wind speed perturbations. We observed this for some projects with greater frequencies of high wind speeds near turbine high wind speed cut-out and with turbines with "storm control" features. There was a bug in the interpolation of the sensitivity curve used in the Monte Carlo simulation for these projects which has now been fixed. The bug had impacted the P50 gross yield and subsequent yields reported from the Monte Carlo Net Energy simulation.
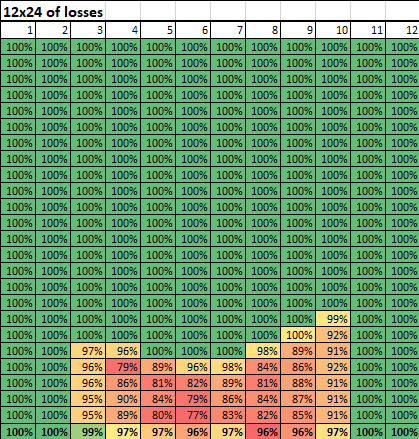
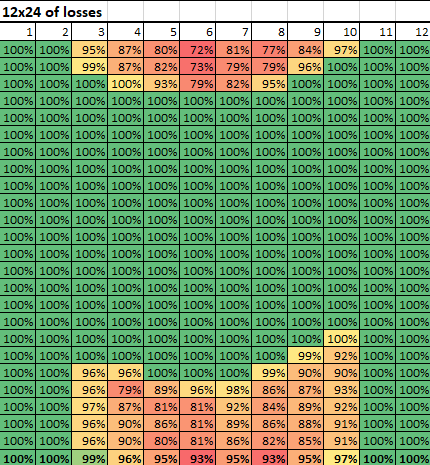
Curtailments support relative to sunset or sunrise rules that cross midnight
We have fixed a problem where curtailment rule time ranges could be truncated at midnight. This only occurred for curtailment rules where start or end times were defined relative to sunrise or sunset, and the condition applied for long enough that the time span crossed into the next day, or previous day, for some days in the year.
The changes in energy efficiencies are illustrated below for a project with shut down curtailment time range rules that begins 6hrs after sunset and ends 8 hours later. The tables show energy efficiency due to the curtailment for months across and hours down. Note that other conditions were are also applied in the curtailment rule.
| Before fix | After fix |
|---|---|
 |
 |
WindFarmer: Analyst 1.3.7 (2022-12-09)
To extend the capabilities of our coming environmental module and add to the noise analysis capabilities released in 1.3.6, WindFarmer: Analyst 1.3.7 includes expanded shadow flicker reporting and exporting analysis capabilities. The Environment module is currently available for private preview, please contact renewables.support@dnv.com if you are interested.
For those who are not using the Environment module, this minor release includes also includes bug fixes and a minor improvement to turbine type reporting.
New Neighbour turbine types TSV file export
In WFA 1.3.6 the TSV reports were updated to increase the traceability of analysis with multi-mode, multi-turbine types. Turbine types for neighbouring turbines were not however reported. We now have a separate report for neighbouring turbine types.
Shadow flicker & Noise Beta Private Preview
Shadow flicker TSV reports
WindFarmer: Analyst now reports shadow flicker TSV files.
- Shadow flicker summary results.
- A time series of flicker from each turbine for each receptor.
- Per receptor, daily flicker start and stop times due to each turbine with totals (similar to the legacy WindFarmer 5.3 export format).
Shadow flicker EPA sections
Shadow flicker has been added to the Word EPA report.
Export shadow flicker map data
Shadow flicker grids can now be exported in multiple formats, as for noise grids.
- Surfer grid files (*.grd)
- XYZ files (*.xyz)
Vector files (*.shp) (contours
Bugs fixed
- Classic annual energy production calculation doesn't report turbine types modes used in Turbine Types.tsv.
Time series loading and saving does not work correctly under the Croatian locale or with certain non-ascii characters in the temporary folder path name.
Environment module bugs fixed:
- Noise receptors on map show previous results if no noise result exists for scenario.
- After selecting the place receptor tool you can't select other map tools.
- Can't paste into the background noise measurement table.
- Background Noise chart doesn't show multiple selections.
- Noise calculation dialog shows incorrect units for ground effects.
- Shadow Flicker map layer persists on changing scenarios.
WindFarmer: Analyst 1.3.6.1 (2022-11-23)
This hotfix release fixes an issue with the WindFarmer Scripting Python SDK not being usable.
WindFarmer: Analyst 1.3.6 (2022-11-15)
This minor release contains some changes to reporting TSV folder structure, the Turbine Types.tsv and the Operational Modes intermediate results and some bugfixes. This release also has the beta noise feature in the environment module available for private preview, please contact renewables.support@dnv.com if you are interested.
Noise Beta Private Preview
Our new beta noise module is included available to users with the environmental module in this release. You can now define receptors at locations sensitive to noise or shadow flicker and test the noise impact at the receptors against your user defined limits to determine the validity of your layout. You can also compute noise or shadow flicker maps.
Please see the user guide and calculation reference for more details.
TSV Reports, Turbine Types.tsv and Operational Modes.tsv
TSV Reports are now generated with a folder structure to make it easier to find where your results are.
The Turbine Types.tsv now will only report what turbine types and modes are used in the energy calculations. There is currently a known issue where neighbouring turbine types will not appear unless they are also in a non-neighbour wind farm.
The Operational Modes.tsv intermediate output from the Power Time Series calculation now states the air density as well as the operational mode to make it more clear which power curve is being used.
Bugs fixed
- WindFarmer: Analyst crashing when trying to download elevation data
- Calculation resulting in object reference error when running Toolbox.CalculateEnergy() in scripting
- Turbine target wind speeds are ignored after running the flow model
- Optimiser using random walk not generating points correctly
- Efficiency results view not refreshing when changing scenarios
- Very closely spaced turbines incorrectly detected to be in wake by rough wake calculation
WindFarmer: Analyst 1.3.5.1 (2022-09-23)
This minor release adds some functionality to allow time series to be scaled by month in scripting and some bug fixes. We have also released a new Wind Resource Grid (WRG) import script to assist you in performing mastless energy assessments.
Scale Time Series by Month
The Time series can be scaled by month in scripting. See script tool for an example to generate a long term hub-height wind speed time series.
Example script to import WRG with no mast
A WRG file can be imported with no mast in scripting. An example script and workbook is available in the knowledge centre.
Bugs fixed
- Small differences in the overall turbine interaction efficiencies reported in the executive summary vs the detailed break down show in section 5.1 of the word report
- Errors in log when navigating to the elevations task
WindFarmer: Analyst 1.3.5 (2022-08-22)
WindFarmer: Analyst 1.3.5 includes the new TurbOPark model from Ørsted, some performance improvements in the power time series calculation and some bug fixes.
TurbOPark – available on request for experimentation
WindFarmer: Analyst 1.3.5 includes the TurbOPark model as released by Ørsted [32] and published in [33].
The model implemented in WindFarmer uses the expansion parameter of A = 0.04 from Ørsted’s model tuning against offshore projects as described in [34]. During the model tuning, TurbOPark was run coupled to a blockage model, which is further developed beyond the Rankine Half Body described in [35]. Whilst Ørsted's updated blockage model remains unpublished, we suggest results from TurbOPark run in isolation without that blockage model should be treated as experimental and not used for commercial work.
If you would like to experiment with TurbOPark, please contact WindFarmer support and we can activate this feature for you by providing a licence update.
Turbulence intensity rescaling setting
The TurbOPark model assumes the same turbulence at all locations on site. This differs to the WindFarmer Eddy Viscosity model that holds standard deviation constant allowing ambient turbulence to change with the wind flow speedups.
By default, we use the model default turbulence re-scaling options, but you can override this by adjusting a turbulence rescaling option in scripting.
Workbook.ModelSettings.EnergySettings.TurbulenceSettings.ExtrapolationAmbientTurbulence =
    ExtrapolationAmbientTurbulenceType.ConstantWindSpeedStdDeviation;
Performance improvements for wake and power calculations
As we implemented the TurbOPark wake model we refactored and simplified parts of WindFarmer’s wake and power calculations. We have reduced the memory consumption for the frequency domain Annual Energy Production calculation and maintain similar run times vs. 1.3.4.1.
The power time series calculation is now up to 4 times faster, but may consume 3 times more memory. Memory consumption improvements for the power time series calculation have been identified for future work.
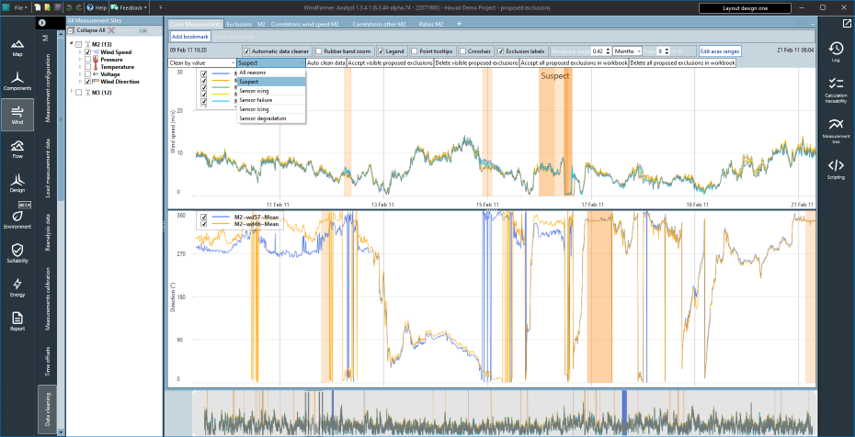
Improved automated data cleaning exclusion review process
The proposed exclusion review tools now support the ability to filter the proposed exclusions to show then accept or reject only one type of proposed exclusion at a time. The filter applies to both proposed exclusions shown on the time series and data points shown on scatter plots. The accept or delete actions only apply to the visible proposed exclusions. This allows you to rapidly accept exclusions from automated data cleaning algorithms that you are confident produce good results, but apply more scrutiny to exclusions predicted by other algorithms.
Ideal yield calculation now available in scripting
Ideal yield for a turbine is the annual energy production for a turbine if it was placed at the location of its initiation mast. You can now get this result from scripting if you turn the ideal yield calculation on, have wind climate data at the mast at turbine hub heights, and use the new energy calculation:
C#:
Workbook.ModelSettings.EnergySettings.CalculationToUse = EnergyCalculationToUseType.New;
Workbook.ModelSettings.EnergySettings.CalculateIdealYield = true;

Toolbox.CalculateEnergy();
Scenario results = Workbook.CurrentScenario;

foreach (ReadOnlyTurbine turbine in results.Turbines)
{
    double idealYield = results.TurbineTotalYields.GetVariantResult("Ideal").GetValueForTurbine(turbine).Value / 1000.0; // Converting to MWh/annum
}
Python:
Workbook.ModelSettings.EnergySettings.CalculationToUse = EnergyCalculationToUseType.New
Workbook.ModelSettings.EnergySettings.CalculateIdealYield = True

Toolbox.CalculateEnergy()
results = Workbook.CurrentScenario;

for turbine in results.Turbines:
    ideal_yield = results.TurbineTotalYields.GetVariantResult("Ideal").GetValueForTurbine(turbine).Value / 1000.0 # Converting to MWh/annum
Bugs Fixed
Fixed: Validation rules blocked simulation of very large turbines
We adjusted some validation rules to support very large turbines and allow you to model the enormous machines of the future! you can now have Rotor diameters of 999m and a Tower Height max of 500m.
Other bugs fixed
- Unable to open log folder when looking in system information
- Gateway timeout error when downloading default street view map
- In specific cases, some curtailment rules were wrongly detected as overlapping even though they are for different time ranges.
- Power Time Series calculation failing to run due to missing months of data
- Resource Panorama link downloaded duplicate calibrations for specific projects
WindFarmer: Analyst 1.3.4.1 - hotfix (2022-05-24)
This minor release replaces our background image download tool with a new service from Bing Maps. We also include an improvement to the turbine-types setup UI so you can now view a collapsible tree of turbine types helping you to navigate and review many more turbine types together and some useful bug fixes discovered in 1.3.4. This version has no changes to the data model so workbooks created in 1.3.4.1 are compatible with version 1.3.4.
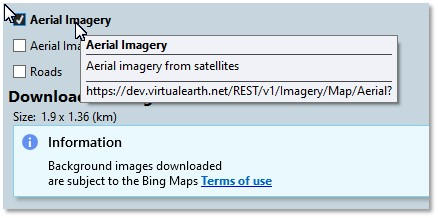
Bing Maps for background imagery download
The background image layer provider used in earlier WindFarmer versions was discontinued. To replace this, Bing Maps has been added to provide fast downloads of open street map and satellite image layers directly in to WindFarmer in your local co-ordinate system.
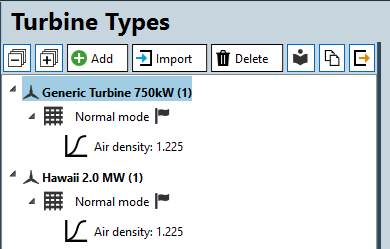
New turbine types navigation tree
The turbine types task uses a new navigation tree to help you quickly explore your turbine types and modes:
Bugs fixed and other improvements
- Fixed: Curtailments XML produced with the 1.3.4 curtailment tool mixed up TimeFromAsTimeOfDay with TimeFromAsSunSetOffset data.
- Resource Panorama link now points to the new DNV address instead of the old DNV GL domain. RP users should upgrade to this version of WindFarmer: Analyst soon.
- Fixed: Installation freezes at VS 2005 runtime installation step
- Fixed: Turbulence intensity distributions input from converted WindFarmer 5 workbooks didn't work in the power time series calculation
WindFarmer: Analyst 1.3.4 (2022-04-26)
This release includes significant improvements to the power time series calculation, including the addition of temperature dependent curtailment impacts estimation, and further improvements to the turbine-types configuration user interface.
Power time series inputs specific to each measured wind climate
To improve power time series prediction accuracy you may want to make use of the specific wind speed measurements that best represent the conditions at each turbine location. For example, at onshore sites with more complex terrain you may have many masts and define an initiation strategy to associate each turbine with a specific mast. WFA 1.3.4 allows you to select specific time series inputs from each initiating measurement site to use as inputs to the power time series calculation. This means you can use the same flow model initiation strategy as you would use for traditional frequency domain annual energy production calculations, but in the time domain.
The power time series calculation now requires you to select a wind speed time series and turbulence intensity input for each measurement site that initiates turbines:
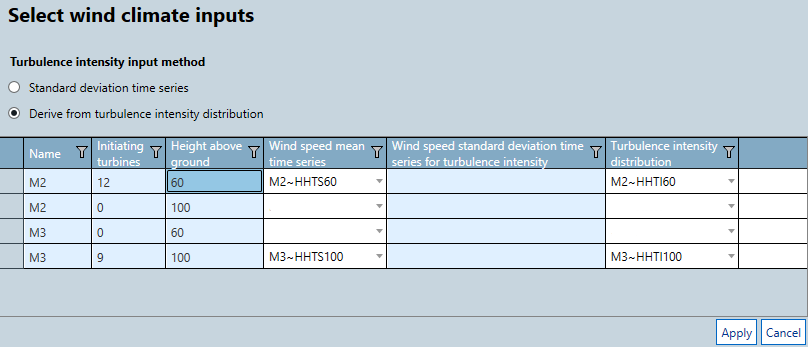
Previously the wind speed and turbulence inputs were the same at all wind climates. See time series wind climate setup for more details.
Temperature curtailments
To quantify impacts on energy production from temperature dependent curtailments, such as bat curtailment or high temperature curtailment, we added temperature curtailment support. You can now define temperature conditions in the curtailment importer spreadsheet where a turbine switches to an alternate mode of operation. These conditions are evaluated at each relevant turbine in the power time series calculation based on a reference temperature time series input chosen in the power time series calculation task. Only one reference temperature time series can be defined for the whole site, which is then extrapolated to each turbine's hub height using the temperature lapse rate (default of -6.5ºC/km).
Further power time series improvements
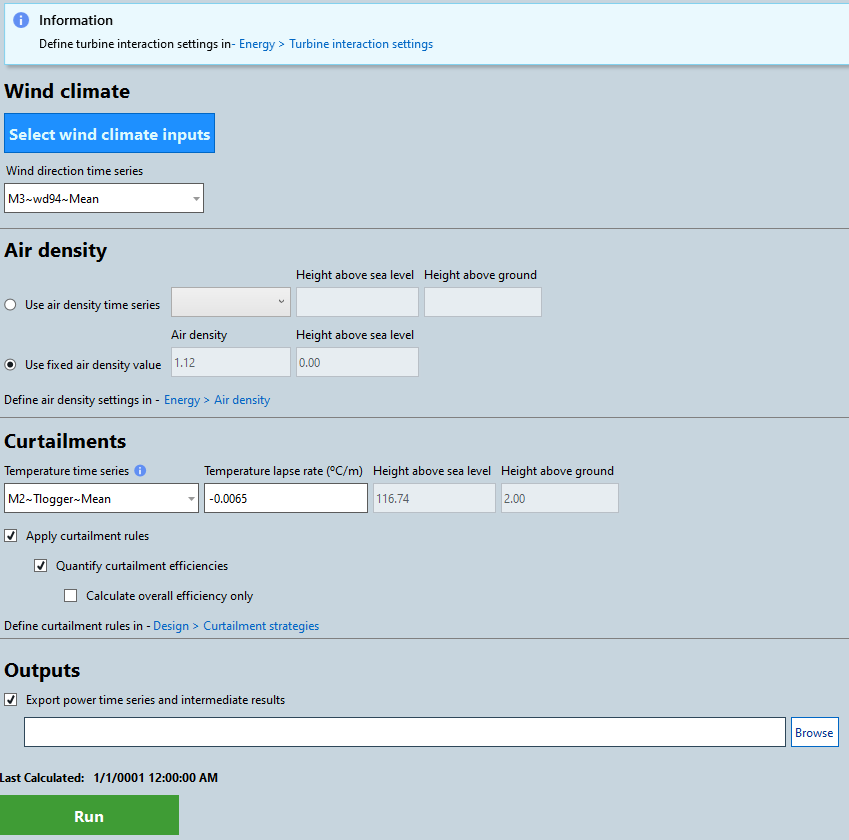
New "turbine interaction settings" task
The Turbine interaction model settings are now defined in one single location. The settings defined in this task are used in both the frequency domain annual energy production (AEP) calculation and in the power time series calculation.
In the power time series task, and other calculation tasks, we hyperlink back to any inputs defined in earlier tasks:
Calculation progress bar and cancellation
The power time series calculation is computationally intensive and may take 10's of minutes to complete. Users can now view a realistic progress bar when running the power time series calculation. If they started the calculation in error, it is now also possible to cancel the calculation.
Extra time series results output by the power time series calculation
We now export more intermediate data to file from the power time series calculation.
| Data | File name |
|---|---|
| Time series inputs (matched) | WFAPowerTimeSeriesInputs.tsv |
| Turbine operational mode | WFAPowerTimeSeries_OperationalModes.tsv |
| Waked wind speed | WFAPowerTimeSeries_WakedWindSpeeds.tsv |
| Power output | WFAPowerTimeSeries_PowerOutput.tsv |
| Ambient wind speed | WFAPowerTimeSeries_AmbientWindSpeeds.tsv |
| Temperature at turbine (if temperature set) | WFAPowerTimeSeries_TemperatureAtTurbines.tsv |
Turbine types UI improvements
Importing .trbx files to add modes or performance tables data to existing turbine types.
Many WindFarmer users have compiled a library of turbine type definitions as .trbx files for individual turbine type modes and specific air densities. To use these in the new multi-mode, multi-air-density turbine type model in 1.3.4 we have added the ability to import .trbx files to define extra turbine type modes or air-density-specific performance tables. The extra modes or performance tables are appended to those pre-existing on a turbine type already in your workbook.
Ability to select the 'normal' mode in turbine types task
You are now able to set which operating mode is the 'normal' mode in the UI.
Bugs fixed and usability improvements
We have also fixed the following bugs reported by users:
Power time series calculation could not find the input time series after they had been re-calculated
Power time series results were hard to parse in python with pandas read_csv. Note that this means the power time series file format has now changed.
Turning off the Blockage Model hid the Apply Hysteresis option
Power Time Series calculation using the Modified Park wake model required std dev turbulence
Pasting multiple columns in turbine performance table resulted in empty cells that cannot be edited
Placing turbines without a Turbine Type defined crashed WindFarmer: Analyst
Turbine type mode not found due to trailing spaces in name
Time zone setting fails for some site locations - so automatic time offset correction for downloaded Reanalysis data failed
Conversion of contour .map files to gridded elevations (DTM) was slow
The following minor usability improvements have been made:
We now display the height above ground of the air density time series used in the power time series calculation
The Curtailment Importer tool now shows the CurtailmentTypeName dropdown in view when it is opened
WindFarmer: Analyst 1.3.3.2 - hotfix (2022-03-30)
This hotfix release fixes a critical issue around an error in our mapping component stating a license has expired. This version has no changes to the data model and workbooks created in 1.3.3.2 are compatible with version 1.3.3.
WindFarmer: Analyst 1.3.3.1 - hotfix (2022-02-21)
This hotfix release fixes a bug introduced in the 1.3 release relating to importing of roughness data from the Elevations task not importing line features correctly. This version has no changes to the data model and workbooks created in 1.3.3.1 are compatible with version 1.3.3.
Not all roughness data is loaded when imported via the Elevations task
Now both line and area features of roughness are correctly imported in the elevations task.
Previous imports with combined contours and roughness should be removed and re-imported if imported from the elevations task.
Data corruption on pasting data into the turbine performance tables
Users are now able to paste data into the turbine performance tables in the Turbine Types task.
New energy calculation fails for turbine at mast location
Now only uses the flow model prediction for the turbine. A warning is issued if the mean wind speed predictions of the flow model for the same location differ by 1% or more.
New energy calculation in WFA 1.3.3 fails - speedups are missing from flow model.
Improved the robustness of the lookup and tolerance of speedup and flow model data points.
WindFarmer: Analyst 1.3.3 (2022-01-26)
In this minor release we listened to user feedback and enabled measurement site import from other workbooks and projection system setting by EPSG codes. We also brought the new energy calculation out of BETA by added missing functionality. Furthermore, by addressing some bugs we have improved the robustness of the power time series calculation, fixed performance issues in the turbine type setup UI and addressed other issues.
WAsP from wind atlas supported for WAsP 12
It is now possible run a WAsP wind flow calculation with a wind atlas (.LIB file) as the input within WindFarmer: Analyst using WAsP 12 or WAsP 11.
New energy calculation out of BETA
After much testing and use by DNV analysts we have expanded results available from the New energy calculation option and are pleased to bring this calculation version out of the Beta state. The New energy calculation is significantly faster than the classic energy calculation and there are some bug fixes in some edge cases as described in the 1.3 release note below. In this release all Flow and Performance Matrices (FPMs) have been made available from the New energy calculation (except design equivalent turbulence). We also have improved the results data accessible from scripting with this calculation type.
There are some remaining limitations, we suggest that you use the classic calculation type option if you need the following calculations / options:
- Non-association method
- Direction shifts to sector probabilities
- Design equivalent turbulence calculations.
Import measurement sites from other workbooks
It is now possible to import the measurement sites from another WindFarmer workbook into your current workbook. This new feature can help you share work between multiple people, then merge the quality checked data in to one workbook for the wind analysis.
Expanded projection system setup options
We now provide more options for setting the projection system. Whenever you pick the co-ordinate system for the workbook, or define the system for data being imported, you can:
- Set the projection system using an EPSG code. See https://spatialreference.org/ref/epsg/ for a searchable reference database.
- Set the projection by loading a .prj file which contains a Well Known Text (WKT) description of the co-ordinate system
- Modify or review the advanced parameters that define the system origin and offsets.
Bugs fixed
The following bugs and annoyances have all been fixed:
Cannot create wind climate with reanalysis data. You can now use reanalysis data to create wind climates.
WRG fails to load because Weibull parameters are outside of a valid range. There are no longer any restrictions on valid A and k values when importing a WRG.
Validation of Curtailment Rules incorrectly rejected the valid case when only 1 one rule crosses midnight and others do not.
Elevation contour to grid conversion is slow compared to WFA 1.3.1.1.
Power time series calculation failed with error “Wake calculation failed to produce non-negative incident wind speed and std deviation”. We now handle without complaint the case where the input data gives a turbulence of zero.
Pasting data in Turbine Performance Table was slow.
Turbulence intensity for a performance table has the wrong units or wrong defaults in turbine types UI. The default is now 10%.
Blockage model fails with frequency distribution input having integer wind speed bin boundaries
Classic energy calc fails with error 'bad array new length' due to invalid terrain data.
Multi-selection of Reanalysis Node and another Measurement Site type results in crash
Issues when attempting to export TSV reports from the python SDK.
The measurement height assumed for the Long term wind speed can get out of sync with the user input measurement height causing erroneous LTHHWS in calculated wind climate. This only occurred if the user updated the measurement properties after setting up the long term adjustment. The target Long-term-hub-height-wind-speed calculation in Calculate Wind Climate is now more robust to measurement height changes - just re-calculate the wind climates after changes to inputs.
WindFarmer Analyst 1.3.2 (2021-11-18)
Gridded layout generator
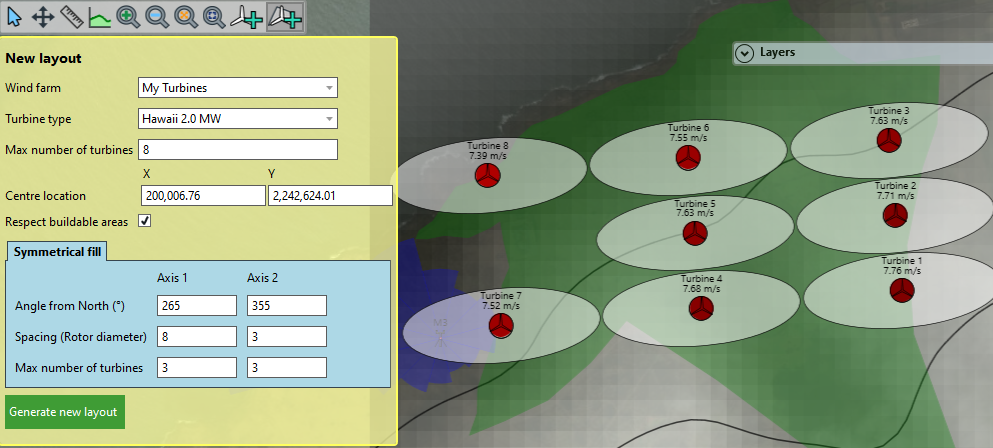 Regularity in layout is often required to comply with navigational restrictions for offshore wind farms. WindFarmer: Analyst 1.3.2 includes a new tool to generate regular gridded layouts. You can now quickly fill your buildable area with an array of turbines. This can be particularly useful when creating several design scenarios to consider at the indicative design stage of a project.
WAsP 12
This release has also been updated to support WAsP 12 wind flow calculations. Ensure the WAsP 12 license is applied in the stand-alone WAsP software then you can select WAsP 12 in WFA.
WAsP 12 results are slightly different to those from WAsP 11, mainly because of a modification to account for geostrophic shear.
Extended TSV results
The "Project uncertainties.tsv" report now includes all of the net energy distribution data and uncertainty breakdown shown in the UI and word reports. The file includes a more comprehensive description of net energy model and uncertainty inputs.
Every TSV now specifies which scenario was active when the results were generated.
Improved co-ordinate system support
We have updated our GIS component to fix some bugs with Lambert projections and support previously Japan 2011 Datums.
Average base roughness calculation (Basic script only support)
The base roughness is an important input to the large wind farm model. The average base roughness at your turbine locations can now be computed using a scripting toolbox method:
double averageBaseRoughness = Toolbox.CalculateBaseRoughness()
This method frequency weights the directional base roughness exposure at each turbine location then averages this result. More detailed directional roughness exposure data may be exported as a text file report:
Toolbox.ExportBaseRoughnessReport(string.Format(@"C:\MyProject\base_roughness_export.tsv"));
This is a basic feature. To use it a discrete WAsP wind flow prediction must first be made at each turbine location: the base roughness data are calculated within the WAsP calculation, they are not calculated if you import external flow model data or simulate a full target area in WFA.
Bugs fixed
Issue with lock file when saving to network drives
The "lock file" mechanism that prevents 2 users from overwriting each other's work working on the same project is now more robust when permissions to access the user profile are blocked.
Reanalysis data download timeout increased
The timeout for downloading reanalysis data has been increased to reduce failures when there is a poor connection with the service.
Turbulence intensity required when wake model is off
Previously wake model settings on turbulence intensity could stop an energy calculation from running if there was no turbulence intensity defined in the wind climate even if the wake model was unselected or the Park model, which doesn’t require turbulence intensity, was selected.
Blockage calculation using first power curve in normal operation instead of closest to average air density
The blockage calculation will now use the power curve closest to the average air density if multiple power curves are defined for a turbine. This is then adjusted to the average air density at turbines.
Flow calibration tuning blockage calculation was outside the tuning loop
The blockage calculation which is needed for flow calibration tuning was previously performed outside of the flow calibration tuning loop. Given the blockage correction has some dependency on wind speed this could result in small differences in the derived flow calibration value depending on the starting calibration tuning value. The blockage correction calculation now runs for every iteration of the flow calibration calculation meaning the process will always converge to the same value.
Undo/redo null reference exception on re-projection
Previously when reprojecting the workbook data if the reprojection was undone and then redone it could cause a null reference exception.
Placing turbines when map projection is not set
Previously it was possible to add turbines to a workbook when the map projection was not set, this could cause issues when using the workbook later.
Reporting wrong capacity when excluding turbines from calculation
Previously when excluding wind turbines from the calculation and generating a report the report would not update the total capacity, or when viewing scenario statistics
WindFarmer Analyst 1.3.1.1 - hotfix (2021-10-20)
This hotfix release fixes a bug introduced in the 1.3.1 release relating to reporting of efficiency results. This version has no changes to the data model and workbooks created in 1.3.1.1 are compatible with version 1.3.1.
Bugs fixed
- “1b wake effect external” shown in the Energy > Efficiencies task is always 100% when calculated using the “Classic” energy calculation type. This bug was introduced in the WFA 1.3.1 release: 1.3.0.3 did not have this issue.
- The “New” (Beta) energy calculation type had the following issues:
- “Total wake” efficiency and “Turbine interaction efficiency” reported on a per-turbine basis also incorrectly included the hysteresis efficiency.
- When running Toolbox.CalculateEnergy() from a script, using the new energy calculation type, the “Overall curtailment efficiency” shown in the Energy > Efficiencies task and the Last calculated date-time for energy / wake calculation were not updated.
- Crash when downloading measurement site data using the Resource Panorama link.
WindFarmer: Analyst 1.3.1 (2021-09-23)
This minor release brings a significant performance boost for larger workbooks with hundreds of turbines or lots of map data. We have achieved the performance improvements by optimising our approach to validation and moving some tasks to background threads. This release also improves the time series curtailment impact estimation feature and fixes some bugs.
Performance improvements
Improved performance working with turbines
The following actions are much faster:
- Adding & removing turbines to the map
- Pasting, deleting and un-doing paste actions into the place turbines grid
- Selecting and moving a turbine location on the map
Improved performance working with scenarios
Creating and switching scenarios in large workbooks is much faster. A 180 turbine test workbook switches scenarios in 20% of the time taken in 1.3.0.1.
Faster workbook open
Larger workbooks can be opened faster. A 180-turbine test workbook stored locally now opens in 30% of the time taken in 1.3.0.1. For small workbooks the change is insignificant.
Faster start-up
Starting the WindFarmer: Analyst application is also approximately 14% faster.
Curtailment Rules - more flexible time range conditions
Curtailment rule time ranges have been changed to make them more flexible. You need one "From" time value and one "To" time value, but they can be a mix of time range condition types on any settings for example "From 1 hour before Sunset To 02:00:00". See curtailment rule conditions for more information.
UI Improvements
- TSV Exports now include an expanded properties section for traceability, including the workbook they are from, the active scenario, when they were generated and what version of WindFarmer: Analyst they were generated from
- About box now shows minimum License version required to run calculations.
Bugs Fixed
Fixed curtailment issues
- Curtailment efficiencies calculated were double accounted in the net energy model if calculated with the new frequency domain energy calculation. This was because the curtailment efficiency incorrectly also appeared in the external wake efficiency category in the net energy calculation inputs.
- Frequency Domain calculation with only wind speed conditions or only wind direction conditions in curtailment rules can incorrectly predict > 100% curtailment efficiency.
- Curtailment rule time range conditions of 00:00:00 are incorrectly being removed on import
- Crash launching curtailment importer tool fixed. The curtailment importer spreadsheet has been updated to allow you to import a curtailment rule xml file exported from WindFarmer in to this tool.
- Empty Wind Farm Specific Rule created in XML from curtailment importer when none in specified in excel sheet workbook
Fixed crashes
- Crash opening a mast in data cleaner with a parenthesis in name
- Crash running new energy calculation with a dictionary error when duplicate wind speed entries are input in a power curve
- Crash running the new energy calculation with irregularly binned tab file inputs
Fixed UI issue
- Turbine exclusion ellipse not shown on adding a new turbine
- Turbine Type Comments don't wrap in text box
Fixed scripting issues
- Intellisense in cost benefit algorithms scripts is not working
WindFarmer Analyst 1.3.0.3 - hotfix
This release is a hotfix release to update authentication to Veracity services like Resource Panorama and Reanalysis Data
WindFarmer Analyst 1.3.0.2
This release contains more bug fixes as well as a few new features.
New Features
- Manually set wind flow calibration value and re-calculate wind flow statistics using manual value
- Export EPA report in scripting
- Now able to set site location in scripting
Bugs Fixed
- Crash when re-opening workbooks
- ApplyDirectionTrendToDirectionTimeSeries command with List
relativeDirectionShifts overload uses offsets that are one direction step size out - Clone or switching scenario changes all turbine types
- Power time series calculation should use IEC correction method
- Classic energy calc does not produce correct results when power curve is not ordered
- Incorrect power time series results while using WF5 air density correction with varying air density
- Blockage model fails to calculate: "Unable to extrapolate to value NaN given input range 0 to 50"
- Naming issue when appending row in HHTS manual set-up
- Annual variabilities not updating when set in scripting
- Crash from ApplyDirectionTrendToDirectionTimeSeries command with List
relativeDirectionShifts - 16 sector analysis: error message updated if running direction steps not an integer multiple of wind sectors
WindFarmer Analyst 1.3.0.1 - hotfix
This is a hotfix release to fix some bugs in the last release. This version has no changes to the data model and workbooks created in 1.3.0.1 are compatible with version 1.3.
Bug fixes
- Forestry can import multiple elevation file formats instead of just .TIF
- Measurement sites can be selected in wind flow turbine initiations
- Fixed issue with certain workbooks not being able to be loaded in 1.3
WindFarmer: Analyst 1.3 (2021-05-12)
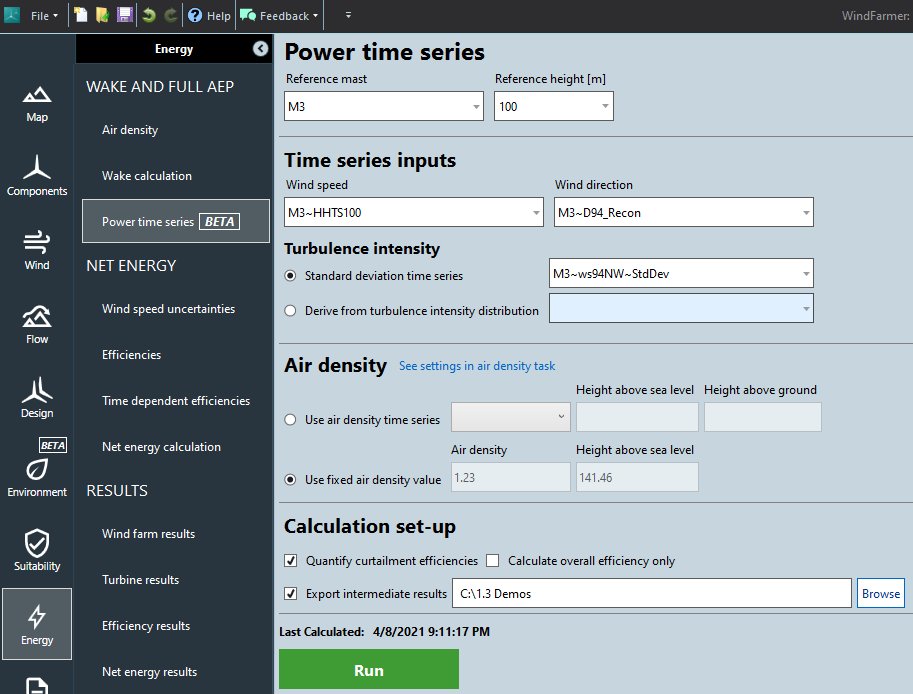
In the major release, WindFarmer: Analyst 1.3, we have introduced a new power time series calculation capable of calculating the impact of curtailment strategies such as noise curtailment or wind sector management where a turbine switches operation mode.
To enable this change we have updated our Turbine Type model and introduced a flexible approach to defining Curtailment Rules that define the operational mode of each turbine. The power time series calculation then allows you to estimate the impact of curtailments which feed directly into your Net Energy predictions.
To enable mode switching within the core of the wake simulation we implemented a new version of our energy calculation. The new calculation is up to 4 times faster for eddy viscosity wake calculations! The new energy calculation closely matches results from the classic calculation except in the case of the close spacing variant of the eddy viscosity model where some bugs have been fixed. In a subsequent release the new energy calculation will become the default calculation version once all options are available. In 1.3 you can choose between calculation versions.
Parts of this new tool chain, including that for time series curtailment modelling, are released in “Beta”. This means we are keen to get your feedback and understand if there is anything extra needed for you to adopt the new methodology.
The release also:
- Enables modelling of forestry impacts in a WAsP wind flow model using the displacement height approach.
- Introduces multiple turbine types with multiple air-density power curves.
- Facilitates wind farm extension analysis and repowering analysis through a flow calibration tuning feature.
- Fixes the elevation data download, introducing 1 arc second SRTM data.
- Introduces long term adjustment uncertainty and long-term consistency checks.
- Improves performance when adding or removing turbines.
Read on to find out more about these and other improvements and bug fixes!
Expanded and improved online documentation
The Latest online docs can now be found here: https://* Resource Panorama link now points to the new DNV address instead of the old DNV domain. RP users should upgrade to this version of WindFarmer: Analyst soon.docs.azureedge.net/WindFarmer:%20Analyst_Latest/
Please update any bookmarks to use this location!
Three new tutorial videos can be found in the knowledge centre or within the user documentation:
- Getting started with map setup
- Getting started configuring your wind farm designs
- Getting started with wind flow modelling
Note
The previous version of WindFarmer: Analyst linked to a fixed version of the documentation from the UI.
Beta: Time series curtailment
The high-level modelling process for time series curtailments is:
- Define multi-mode turbine type specifications
- Define and prioritise curtailment types
Define curtailment rules that cause turbines to switch turbine type mode a. Launch the “curtailment importer spreadsheet” b. Define your curtailment rules in the spreadsheet, note that any rules already within the workbook will be shown in the spreadsheet so you can edit them. c. Export the xml file from the spreadsheet d. Import the curtailments xml file in to WFA. e. Review the curtailments defined in the WFA UI.
Run the frequency domain energy calculation to define the gross yield, wake, and hysteresis efficiencies
- Setup and run the power time series calculation, checking the Quantify curtailment efficiencies box a. For quick checks of results see the Efficiency results task where overall curtailment efficiencies are shown by turbine and wind farm
- Run the Monte Carlo Net Energy simulation to predict net energy including the calculated efficiencies
- Export and review results looking at: a. Curtailment efficiencies by turbine in the turbine results TSV report b. The efficiency break-down table 5.1 in the word report or efficiencies TSV report
For more information about curtailments see curtailment strategies in the user guide.
Power time series calculation
To support the calculation supports of curtailment efficiencies we have introduced a power time series calculation.
The power time series can be exported as a tab separated text file by checking Export intermediate results and specifying a folder path.
See the Power time series section of the user guide for more information.
Current limitations
Important
Mast-to-mast speedups are not currently applied in the power time series calculation. If your flow model data are associated with multiple masts, wind speeds at each mast are assumed to be the same which could result in unintended results. In WFA 1.3 it is advised that to run the power time series calculation you initiate all turbines from the selected reference mast.
Note
The power time series calculates a Full power time series, not a Net power times series: It does not yet consider the blockage efficiency, or any manually definable efficiencies defined in the Net Energy section.
Exporting curtailment results
There are several ways to review curtailment results:
UI:
- Efficiency results task: Overall curtailment efficiency for wind farms and turbines
TSV:
- Turbine results.tsv: Overall curtailment efficiency and break down by type of curtailment for each turbine
- Wind Farm Results.tsv: Overall curtailment efficiency and break down by type of curtailment for each wind farm
- Efficiencies.TSV: Efficiency break-down for all turbines together
Word report:
- Overall curtailment efficiency for each turbine: Table 4.2.X
- Efficiency break-down for all turbines together: Executive summary table and Efficiencies table 5.1.
BETA: Extension analysis and Flow calibration tuning
WindFarmer: Analyst now facilitates extension analysis and re-powering studies with a flow calibration tuning feature. The wind flow adjustment task includes a tool to allow you to tune the wind flow model such that WindFarmer matches the energy yield prediction to the measured yields at installed turbines.

The inputs to flow calibration tuning are:
- Which turbines are installed
- The production yields for the installed turbines.
- A confidence weighting by turbine, this is used to attribute more weight to turbines with better production data quality.
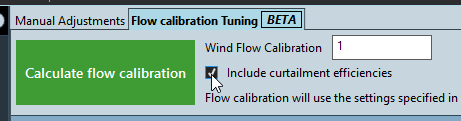
The flow calibration process iteratively runs energy calculations, assesses the error in prediction vs. production then adjusts the flow calibration until convergence. It uses the settings used in the Frequency domain AEP task. If you choose to apply a blockage correction this is also applied during the tuning.
Turbines that are not installed are ignored during the tuning process. Note that installed neighbouring turbines will be considered.
For traceability, we suggest you consider configuring a flow tuning scenario (or multiple flow tuning scenarios) separated from the scenarios used for analysing your wind farm design. For simple projects where there is a single consistent period of production data however, this may not be necessary as the Is installed property can be used to define the turbines to consider in the flow calibration tuning process.
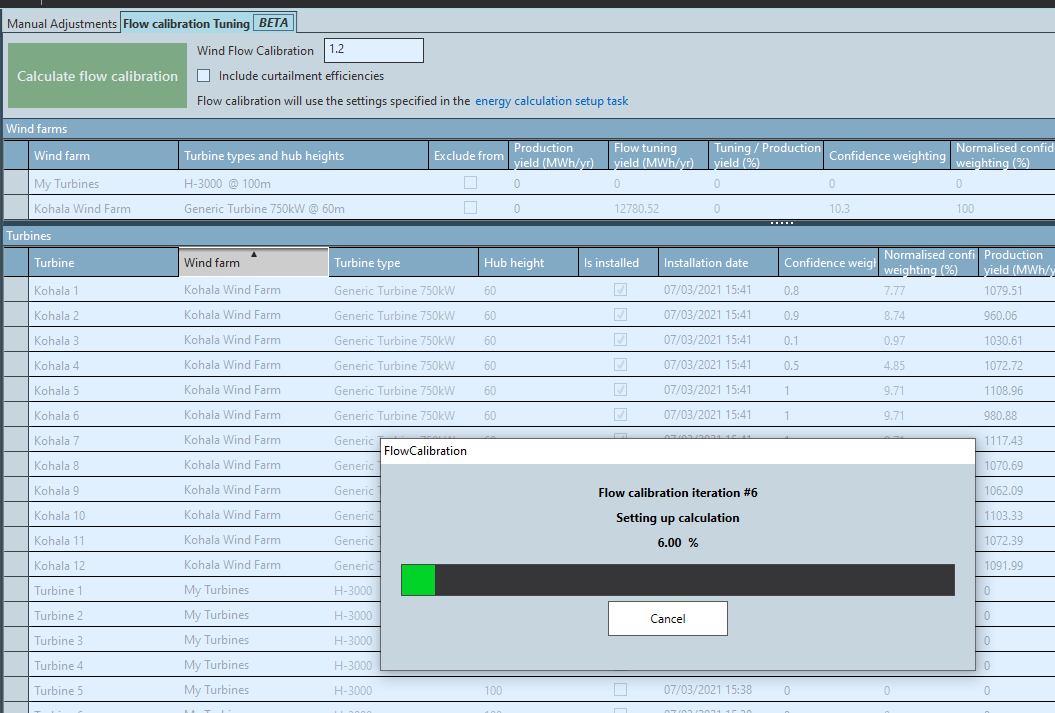
You may also consider curtailments calculated using a power time series in the flow calibration tuning process. Check the box and configure the power time series calculation settings and curtailment rules as required to enable this.
Forestry displacement heights
You can now model the impact of forestry on your WAsP wind flow predictions in WindFarmer: Analyst using the Forestry Displacement Height Calculation.
The process is:
- Import a forestry grid (e.g. a geotiff file or .grd file) in the Map > Forestry task
- Calculate the displacement heights at initiating measurement sites and turbines in Flow > Forestry displacement heights task. 3: Calculating wind flow predictions with WAsP.
Note
Displacement height corrections are only applied when you make discrete wind flow predictions. Remove any flow target areas then run the WAsP flow model ensuring you have placed all the turbines you require. This limitation is because the forestry displacement height calculation works by adjusting the height of the specific turbine or initiating measurement site used in the flow calculation. If you want to consider the impact of forestry in a gridded wind flow prediction, we recommend running a simulation external to WindFarmer (e.g. with a CFD solver) then import the results as a WRG file.
Multi-mode, multi-air density turbine types
To facilitate mode switching in the power time series calculation turbine types now contain multiple modes of operation. Each turbine type mode contains all the Turbine Type properties that define power output for the turbine including:
- A collection of performance tables defining power, thrust and rotor speed for different specific air densities.
- The start stop strategy is defined per mode, so you can have different cut-in and cut-out speeds when you switch mode.
We have created a new version of the TRBX file that you can import to define the turbine types, however you may still import old TRBX or WAsP WTG files and they will be upgraded. When you export a TRBX from WFA 1.3 it is given in the upgraded format.
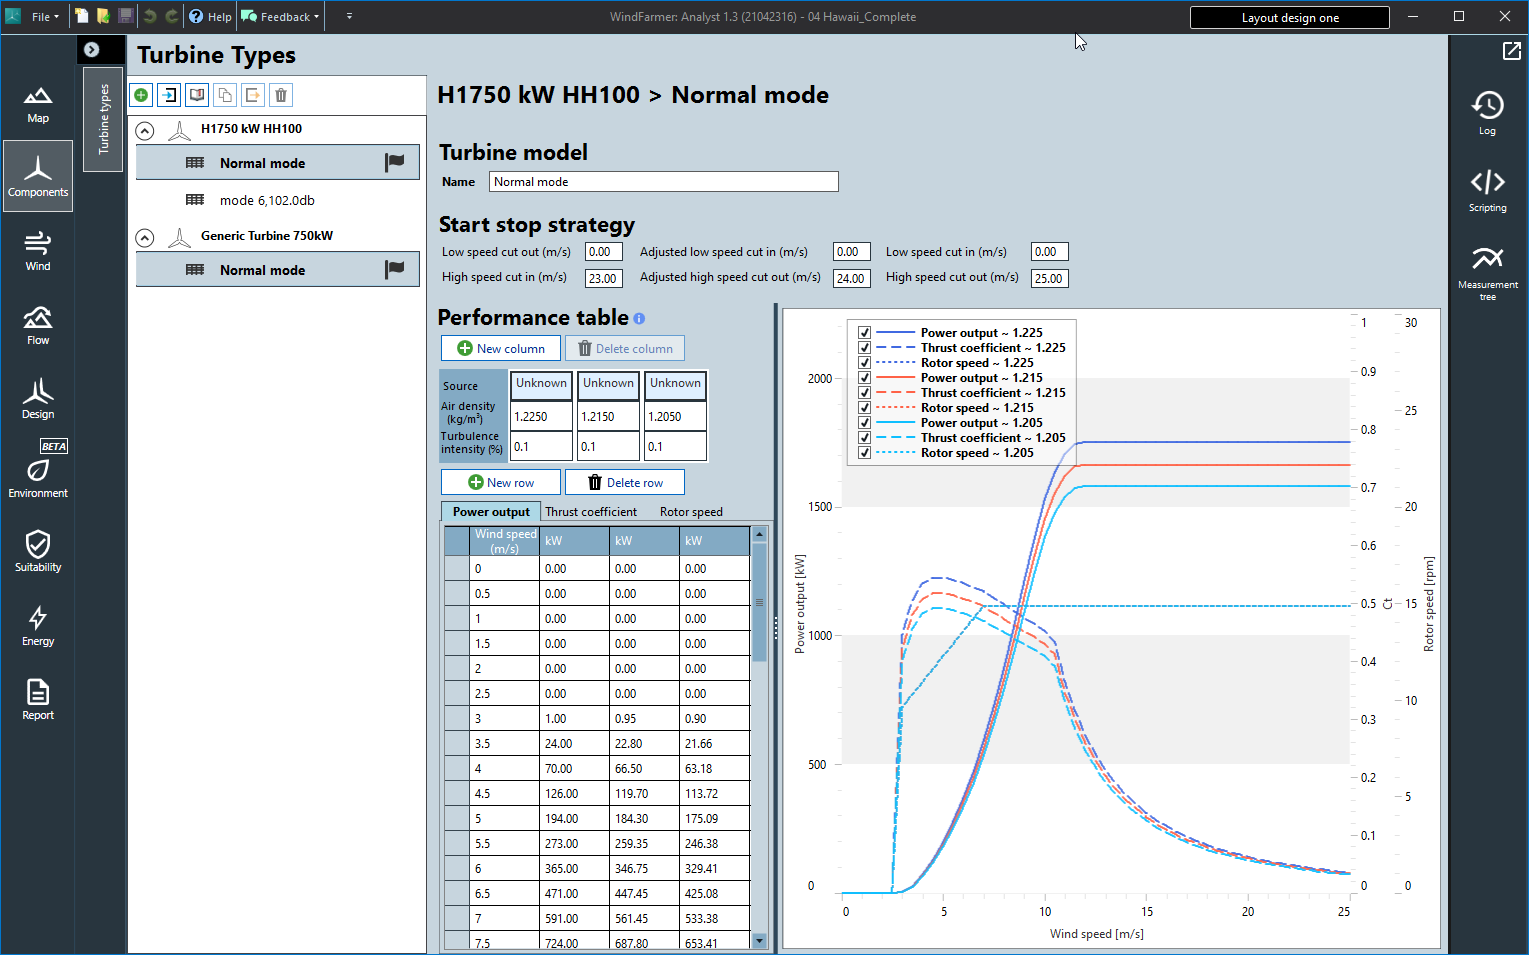
Air density specific power curves
With the introduction of air density specific power curves, the energy calculation now selects the most appropriate power curve to use for predicting power output.
| Calculation version | Power curve air density selection behaviour |
|---|---|
| Classic | The energy calculation picks the closest-in-air-density power curve to the mean air density for all turbines then uses this for all turbines. |
| New | The energy calculation selects the most appropriate air density power curve on a turbine by turbine basis. For the power time series calculation it makes the decision time step by time step. |
Energy calculation changes
To facilitate power time series calculations and the modelling of turbine mode switching at the core of the wake simulation we have rewritten the wake and energy calculation. The new calculation is 2 times faster due to algorithmic optimisations including an analytical approach to the wake profile integration and extensive multi-threading.
You will see two options in the Wake Calculation task to allow you to select the calculation version you wish to use:
The new calculation is used for power time series simulations and flow calibration calculations in all cases. You can choose to use this option when running the frequency domain energy calculation also, though please note there are some limitations on options in this release.
Some new features, improvements, and bug fixes change predictions made by the new energy calculation. For most calculations, the differences in results between the Classic and New version of the calculation are negligible (< 0.05%). More significant changes are expected when selecting the close spacing variant of the eddy viscosity wake model due to some bug fixes. The changes are explained in full below.
New energy calculation: changes and validation
Through implementing the new energy calculation, we have identified several bugs and improvements which impact results. The impact on overall AEP described in the table below present the New - Classic results differences for a test projects that showed the greatest differences in numbers from set of 20 test projects.
| Improvement or bug fixed | Scope | Severity | Impact on overall AEP | Discussion |
|---|---|---|---|---|
| Fixed: Check on nearby neighbours for close spacing factor done twice. The first time its done it uses un initialized data. | Close spacing eddy viscosity calculation | Major | -3% max per turbine bias -0.9% mean overall bias. | Close spacing detection fails on most upwind closely spaced turbines meaning the dominant wake superposition model was used in some cases. The change in results is most pronounced for small wind (e.g. 2 rows). |
| Fixed: In the Lisamen profile wake integration, a negative distance from centre used in a method where the absolute distanced should have been used. | Close spacing eddy viscosity calculation | Minor | -0.1% max per turbine bias -0.03% mean overall | This caused some small asymmetry in incident wind speed depending on which side of the centre line of the wake the turbine downwind turbine was placed. |
| Fixed: In some direction cases a 3rd wake deficit is not included in the wake deficit combination. | Close spacing eddy viscosity calculation | Minor | -0.07% max bias -0.01% mean overall bias | When doing momentum deficit wake addition in cases where the upstream turbine has 2 nearby neighbours withing close spacing 3 wake deficits should be merged at the downwind turbine. The bug here meant the lowest wake deficit could be missed in some wind direction cases. |
| Numerical edge case problem in detection of turbines in wake | Eddy viscosity calculation | Insignificant | -0.04% by turbine -0.004 % mean overall | When determining the added turbulence intensity, some wakes that should not have contributed wakes were included in the wake superposition. |
| Removed re-binning errors by changing simulated flow case bin centres such that bin edges align with input frequency data. | Frequency domain energy calculation | Minor | No impact if using 180 sectors and a 12-sector tab file. Minor impacts for cases where we have 72 or 360 sectors and a 12-sector tab file (e.g. 5 degree or 1-degree bins) | |
| New calculation has first bin centre set at 0.25 m/s, which changes mean wind speed results (classic used 0 m/s) | Minor | + 0.04% seen on a particularly low wind speed site | No impact on AEP. Increases mean wind speed prediction very slightly. The new calculation is more correct |
Comparison of results over many projects
Testing was performed over a significant sample of projects to understand the impacts of the new energy calculation.
Mean bias error = the mean of all biases over all the turbines
Turbine Max bias error = the largest bias for any one turbine
All results are presented in percent [%]
Projects without close spacing
| Project | number of turbines | number of turbines in other farms | turbine full yield mean bias error | turbine full yield max bias error | turbine Gross yield mean bias error | turbine Gross yield max bias error | waked wind speed mean bias error | waked wind speed max bias error | ambient wind speed mean bias error | ambient wind speed max bias error | air density mean bias error | air density max bias error |
|---|---|---|---|---|---|---|---|---|---|---|---|---|
| 0 | 14 | 2 | 0 | 0 | 0 | 0 | 0.01 | 0.01 | 0.01 | 0.01 | 0 | 0 |
| 1 | 11 | 58 | -0.01 | -0.01 | -0.01 | -0.01 | 0 | 0.01 | 0 | 0 | 0 | 0 |
| 2 | 17 | 0 | 0.01 | 0.01 | 0.01 | 0.01 | 0.01 | 0.01 | 0.01 | 0.01 | 0 | 0 |
| 3 | 33 | 8 | 0 | -0.02 | 0 | 0 | 0.01 | 0.02 | 0.01 | 0.01 | 0 | 0 |
| 5 | 52 | 127 | 0 | -0.05 | 0 | 0 | 0.01 | -0.02 | 0.01 | 0.01 | 0 | 0 |
| 6 | 9 | 12 | 0 | -0.01 | 0 | 0 | 0.01 | 0.01 | 0.01 | 0.01 | 0 | 0 |
| 7 | 86 | 213 | -0.02 | -0.05 | 0 | 0 | 0 | 0.02 | 0 | 0 | 0 | 0 |
| 9 | 35 | 24 | 0 | -0.02 | 0 | 0.02 | 0.04 | 0.05 | 0.04 | 0.04 | 0 | 0 |
| 13 | 28 | 10 | 0 | -0.08 | 0 | 0 | 0 | -0.03 | 0 | 0 | 0 | 0 |
| 15 | 6 | 4 | -0.02 | -0.04 | 0 | 0 | 0.01 | 0.01 | 0.01 | 0.01 | 0 | 0 |
| 16 | 97 | 127 | -0.01 | -0.05 | 0 | 0.01 | 0.01 | 0.03 | 0.01 | 0.01 | 0 | 0 |
| 18 | 10 | 6 | 0.01 | 0.01 | 0 | 0 | 0.03 | 0.05 | 0.01 | 0.01 | 0 | 0 |
| 20 | 4 | 40 | -0.01 | -0.01 | -0.01 | -0.01 | 0 | 0 | 0 | 0 | 0 | 0 |
Projects with close spacing
The largest impact is seen at project 4 which has only 2 rows in some aspects, so the impact of the failure to detect close spacing for the most upwind turbines is significant in this case.
| Project | number of turbines | number of turbines in other farms | turbine full yield mean bias error | turbine full yield max bias error | turbine Gross yield mean bias error | turbine Gross yield max bias error | waked wind speed mean bias error | waked wind speed max bias error | ambient wind speed mean bias error | ambient wind speed max bias error | air density mean bias error | air density max bias error |
|---|---|---|---|---|---|---|---|---|---|---|---|---|
| 4 | 27 | 1 | -0.93 | -3.43 | 0 | -0.01 | -0.42 | -1.56 | 0.01 | 0.02 | 0 | 0 |
| 12 | 365 | 0 | -0.33 | -1.35 | 0 | -0.02 | -0.19 | -0.81 | 0 | 0.01 | 0 | 0 |
| 14 | 125 | 0 | -0.61 | -1.05 | -0.03 | -0.07 | -0.41 | -0.7 | -0.03 | -0.08 | 0 | 0 |
| 17 | 50 | 199 | -0.5 | -0.83 | 0 | 0 | -0.17 | -0.33 | 0 | 0 | 0 | 0 |
| 19 | 95 | 0 | -0.31 | -0.89 | 0 | -0.02 | -0.18 | -0.52 | 0 | -0.01 | 0 | 0 |
Modified Park model differences
| Park Projects | number of turbines | number of turbines in other farms | turbine full yield mean bias error | turbine full yield max bias error | turbine Gross yield mean bias error | turbine Gross yield max bias error | waked wind speed mean bias error | waked wind speed max bias error | ambient wind speed mean bias error | ambient wind speed max bias error | air density mean bias error | air density max bias error |
|---|---|---|---|---|---|---|---|---|---|---|---|---|
| 0 | 14 | 2 | 0 | 0 | 0 | 0 | 0.01 | 0.01 | 0.01 | 0.01 | 0 | 0 |
| 1 | 11 | 58 | -0.01 | -0.01 | -0.01 | -0.01 | 0 | 0.01 | 0 | 0 | 0 | 0 |
| 2 | 17 | 0 | 0.06 | 0.36 | 0.01 | 0.01 | 0 | -0.03 | 0.01 | 0.01 | 0 | 0 |
| 3 | 33 | 8 | -0.01 | -0.01 | 0 | 0 | 0.01 | 0.02 | 0.01 | 0.01 | 0 | 0 |
| 4 | 27 | 1 | -0.03 | -0.13 | 0 | -0.01 | 0.03 | 0.06 | 0.01 | 0.02 | 0 | 0 |
| 5 | 52 | 127 | 0 | -0.03 | 0 | 0 | 0.01 | 0.03 | 0.01 | 0.01 | 0 | 0 |
| 6 | 9 | 12 | 0 | 0 | 0 | 0 | 0.01 | 0.01 | 0.01 | 0.01 | 0 | 0 |
| 7 | 86 | 213 | -0.03 | -0.06 | 0 | 0 | 0 | 0.03 | 0 | 0 | 0 | 0 |
| 9 | 35 | 24 | 0.05 | 0.95 | 0 | 0.02 | 0.05 | 0.79 | 0.04 | 0.04 | 0 | 0 |
| 12 | 365 | 0 | 0 | -0.02 | 0 | -0.02 | 0 | 0.01 | 0 | 0.01 | 0 | 0 |
| 13 | 28 | 10 | 0 | -0.01 | 0 | 0 | 0 | 0 | 0 | 0 | 0 | 0 |
| 14 | 125 | 0 | 0.01 | 0.36 | -0.03 | -0.07 | 0 | 0.31 | -0.03 | -0.08 | 0 | 0 |
| 15 | 6 | 4 | -0.03 | -0.07 | 0 | 0 | 0.01 | 0.01 | 0.01 | 0.01 | 0 | 0 |
| 16 | 97 | 127 | 0 | -0.03 | 0 | 0.01 | 0.04 | 0.11 | 0.01 | 0.01 | 0 | 0 |
| 17 | 50 | 199 | -0.04 | -0.13 | 0 | 0 | 0.01 | 0.07 | 0 | 0 | 0 | 0 |
| 18 | 10 | 6 | 0.01 | 0.03 | 0 | 0 | 0.04 | 0.07 | 0.01 | 0.01 | 0 | 0 |
| 19 | 95 | 0 | 0 | 0.02 | 0 | -0.02 | 0.01 | 0.04 | 0 | -0.01 | 0 | 0 |
| 20 | 4 | 40 | -0.01 | -0.02 | -0.01 | -0.01 | 0 | 0 | 0 | 0 | 0 | 0 |
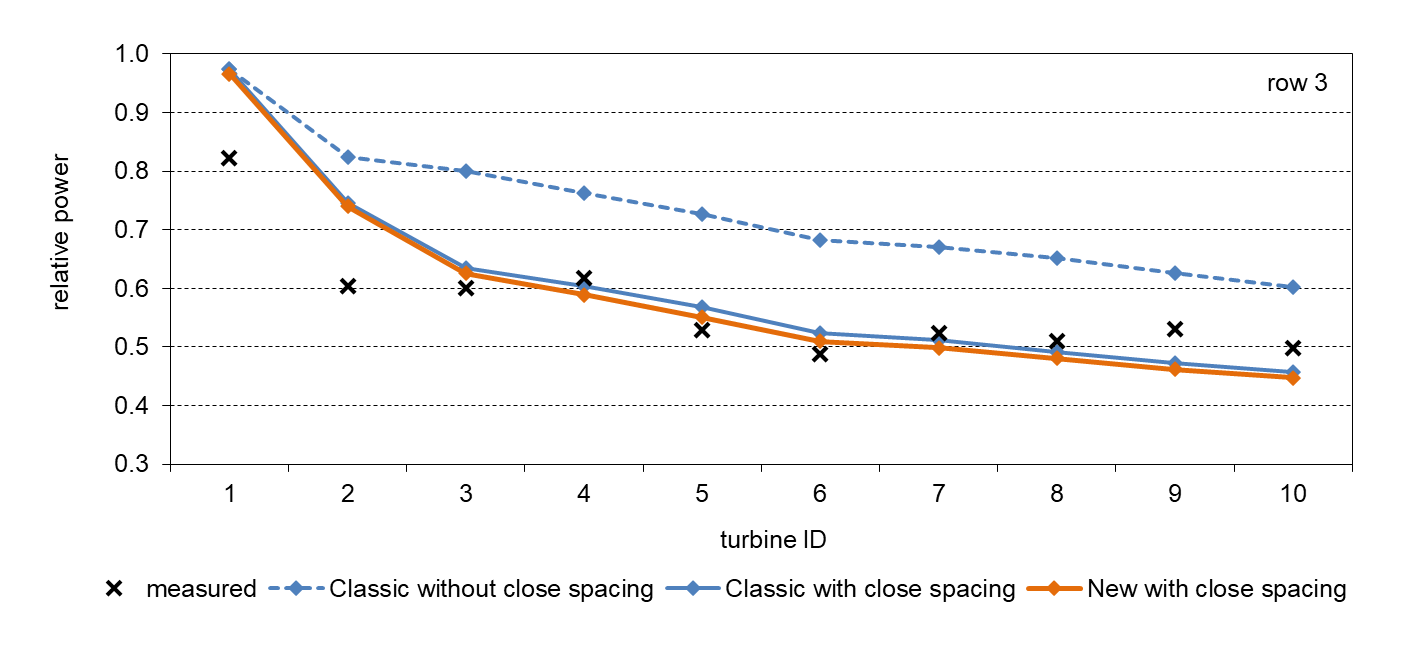
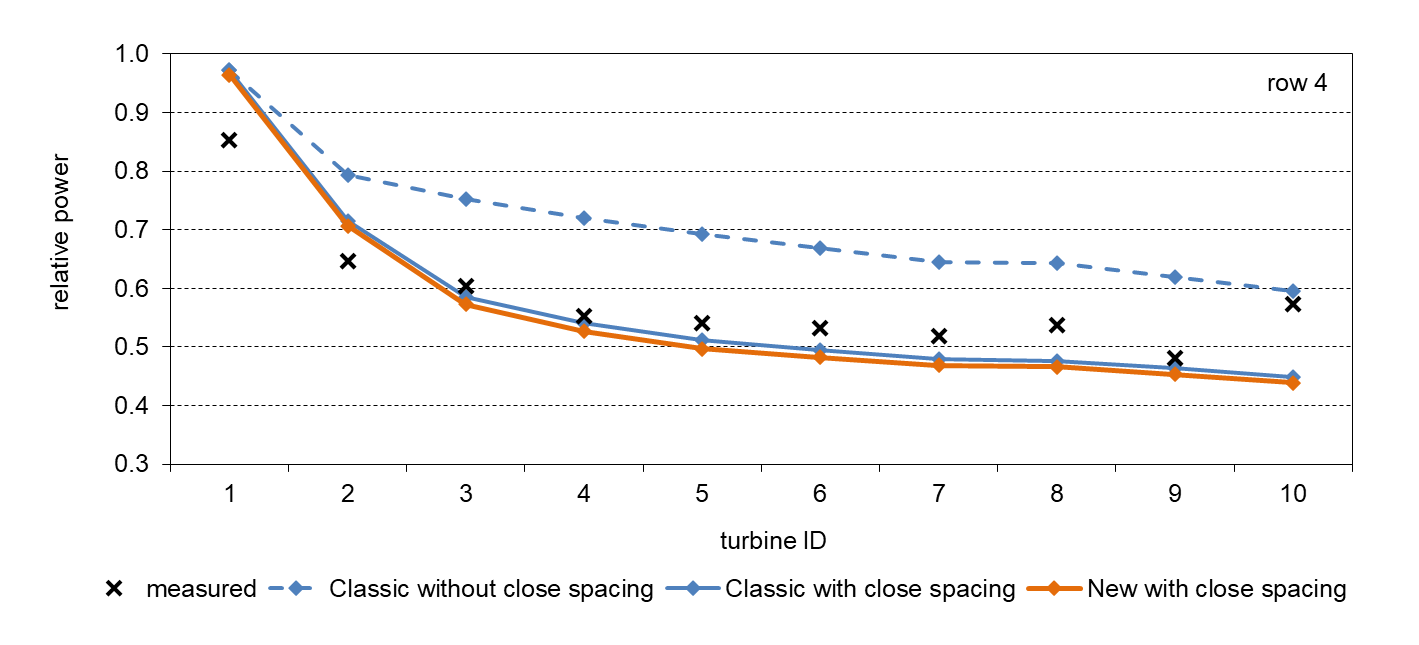
Close spacing model validation flow case plots
We have re-visited our original close spacing model validation cases given the changes to the new model. The changes in results are insignificant compared to the modelling errors so this validation case cannot confirm whether or not the bug fixes bring results closer reality.
Data presented here are from several closely spaced wind farms and are compared for the Classic and New calculation. Results from the Classic calculation without the close spacing model enabled are shown for reference. The free wind speed is 10 m/s, measured at mast located upstream of the wind farms. Note that the wind resource does change within the wind farms so that the wind speed at the single turbines in the same row is different. The power is relative to the average in the first row. The results for single turbines in the 3rd and 4th row in a wind farm are shown.
Performance improvements
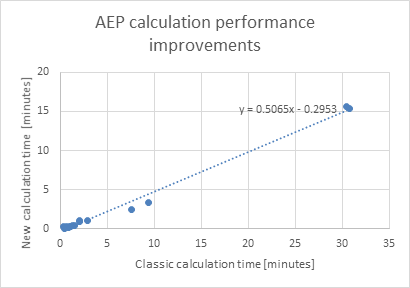
The new energy calculation is twice as fast as the classic calculation for projects of any significant size.
Current limitations of the new energy calculation
- Directional frequency weighting adjustments to sector probabilities option for the association method not supported
- Non-association method not supported.
- Some Flow and Performance Matrices (FPMs) are not yet supported outputs from the new energy calculation.
- 1 Total wind farm electric power
- 6 Mast to Turbine Speedups (note this is a model input for the new energy calculation)
- 10 / 11 Design TI
- 15 Terrain Angle
- There are no turbine binned variants available for any FPMs
- Design equivalent turbulence calculation is not supported (use the classic calculation instead.)
Energy calculation bug fixes and improvements (applying to both classic and new calculations)
Fixed: Overall efficiency reporting with multiple non-neighbour wind farms reports the average efficiency
If you had multiple non-neighbour wind farms in your workbook, the efficiencies reported (e.g. wake efficiency) for the combination of both wind farms was incorrectly reported as the average of those for each individual wind farm. The incorrect efficiencies were used as the input into the Net Energy model, which only considers overall results and does not yet provide per-wind farm results. In most cases there is only one non-neighbour wind farm considered in one workbook and this would issue would have no impact. The overall efficiencies shown in the “Efficiencies” task are now derived correctly by combining the yields from each non-neighbour farm before calculation of efficiencies.
Selectable turbine base height definition data (for air density calculation)
WindFarmer historically defined the base height of turbines from the height defined in the wind flow data (e.g. an RSF or WRG file imported from an external source). In WFA 1.3 we have introduced an option to allow you to set your preference for where height data comes from.
The default for new workbooks is that the height data comes from the elevation grid (or DTM).
The setting for upgraded workbooks prefers to use the wind resource data for compatibility and consistency in results.
Note that if there are no height data in either option then WindFarmer falls back to the alternative option to set the base height.
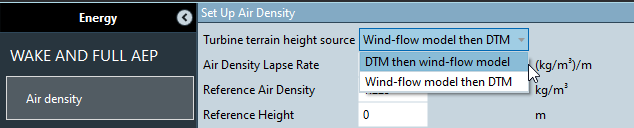
Improved workbook conversion robustness relating to wind climate data
Converting a .wow with multiple projects and multiple wind climates could cause problems with the BEET run. Some of the frequency distributions did not show in the Calculate wind climates task. The issues fixed were dependent on the order of projects defined in the WF5 project and due to some workbooks with having multiple wind resources defined at the same point which could lead to an ambiguous definition of wind resource in WindFarmer: Analyst’s model.
Specify a single fixed turbulence intensity input to the eddy viscosity wake calculation
In WFA 1.3 we re-introduced the capability in WindFarmer 5.3 to specify a fixed turbulence intensity value for use in the eddy viscosity wake calculation.
In general we recommend you find representative turbulence intensity data as changes in turbulence intensity with wind speed have significant impact on the wake effects, however this option may be useful when you need to make a simple assumption because there are no measured data available to define the turbulence distribution.
Where you have a fixed turbulence intensity this is also scaled by the flow calibration, matching the behaviour in WindFarmer 5.3.
One Arc Second SRTM data
The SRTM data download feature has been upgraded to include a 1 arc second option and the data for both 1 and 3 arc second options are retrieved from a new server. It can take a couple of minutes for the download so please be patient.
Long term adjustment improvements
Long term adjustment uncertainty
When predicting long term adjustments, WindFarmer: Analyst now predicts a long-term uncertainty comprising of variability, consistency and synthesis uncertainty. A total uncertainty is also presented to help you select long term adjustment data sources.
To estimate the uncertainty in the correlation between the site and reference datasets, the correlation dataset is divided in two and one half is used to predict the other and calculate the error. Using a Monte-Carlo approach this method is ran multiple times to obtain an estimate of the uncertainty.

Long term consistency check UI
You can launch the long-term consistency view from the long-term adjustment task. Within this view you can see long-term data trends in the data and overlay several time series to help you visually identify possible consistency issues in long term reference datasets.
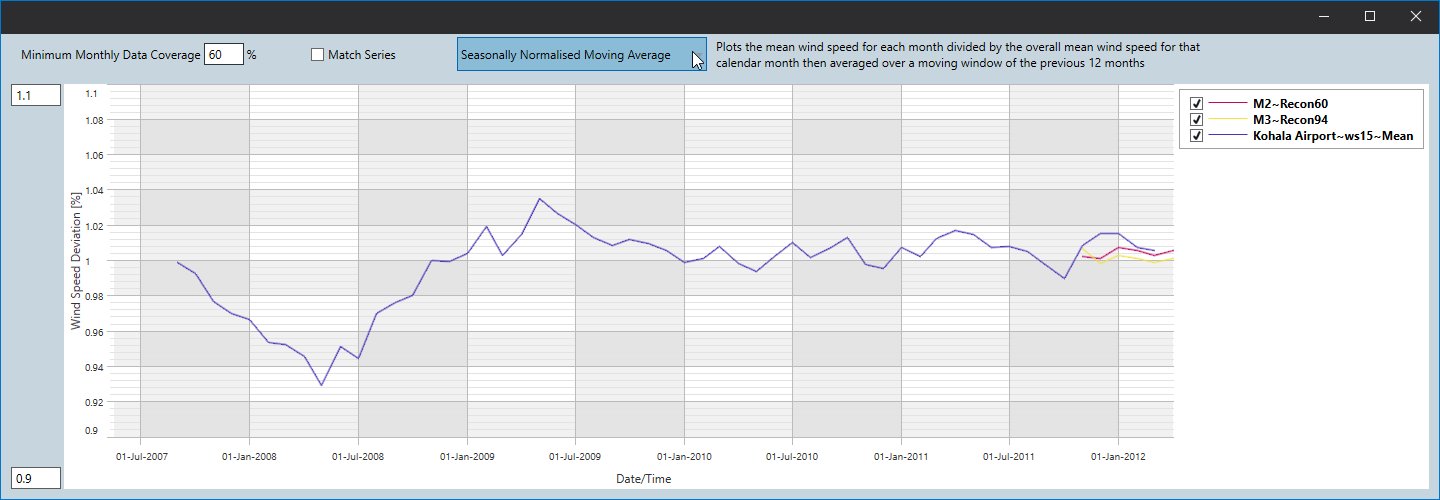
A variety of averaging methods are provided that try to aggregate and plot the long-term datasets in a way that will reveal a change to the distribution (mean or standard deviation or both). You should look for any significant change points in your reference data which could indicate a bias in long term adjustments and, potentially, discard reference data prior to change points from the long-term adjustment calculation.
Air density time series calculation (script)
You can calculate an air density time series for use in the power time series calculation through a script. A future release will show this in the UI.
Python
# get inputs
temperatures =  Toolbox.MeasurementCampaign.GetTimeSeries[TemperatureTimeSeries]("M2~T3~Mean")
pressures = Toolbox.MeasurementCampaign.GetTimeSeries[PressureTimeSeries]("M2~P3~Mean")
relativeHumidities = None # if you don't have a relative humidity time series specify a default fixed value
defaultRelativeHumidityPerCent = 70

# calculate air density
air_density = Toolbox.MeasurementCampaign.CalculateAirDensityTimeSeries(temperatures, pressures, relativeHumidities, defaultRelativeHumidityPerCent)

# save results
m2 = Workbook.Climate.MeasurementSites["M2"]
Toolbox.MeasurementCampaign.SaveResultsTimeSeries(airDensity, m2, "AirDensity")
C#
// get inputs
TemperatureTimeSeries temperatures =  Toolbox.MeasurementCampaign.GetTimeSeries<TemperatureTimeSeries>("M2~T3~Mean");
PressureTimeSeries pressures = Toolbox.MeasurementCampaign.GetTimeSeries<PressureTimeSeries>("M2~P3~Mean");
RelativeHumidityTimeSeries relativeHumidities = null; // if you don't have a relative humidity time series specify a default fixed value
double defaultRelativeHumidityPerCent = 70;

// calculate air density
AirDensityTimeSeries airDensity = Toolbox.MeasurementCampaign.CalculateAirDensityTimeSeries(temperatures, pressures, relativeHumidities, defaultRelativeHumidityPerCent);

// save results
MeasurementSite m2 = Workbook.Climate.MeasurementSites["M2"];
Toolbox.MeasurementCampaign.SaveResultsTimeSeries(airDensity, m2, "AirDensity");
TSV results export changes
A number of improvements have been made to the TSV reports:
You can now export the reports from scripting:
Toolbox.ExportResultsTsvFiles(my_folder_path)
- A new flow calibration TSV report summarises the flow calibration results
- Curtailment efficiency breakdown is provided in the turbine results.tsv and wind farm results.tsv.
- Power time series derived full yield is presented in turbine results.tsv and wind farm results.tsv for comparisson to that from frequency domain.
- Efficiencies.tsv includes time dependent efficiency input settings
Bug fixes
- Performance of adding and removing turbines greatly improved
- Minor map performance improvements rendering turbines and changing scenarios
- Startup times reduced by 15%
- ADC batch training data export gives inconsistent export results, errors on loading time series
- Async exception running the optimiser after going to the efficiency pages
- Wording in farm selection for blockage causing confusion
- m^3 units in Energy > Air density task show up as "?"
- Note property for efficiency or uncertainty line items is not available in scripting
- Unnecessary and incorrect warning in Flow, Flow model review when no turbulence intensity distribution
- "Item with the same key" error when importing excluded farms when no mast is present
- TimeSeriesEnergyFromTimeSeries script does not handle French regional settings
- Threading exception when importing incorrectly formatted external flow model files
WindFarmer: Analyst 1.2.2.1 (2020-11-06)
1.2.2.1 is a minor release to fix some bugs and address some user feedback since the 1.2.2 release. We recommend upgrading from 1.2.2 to 1.2.2.1 for improved stability.
Import a wind farm from an old project containing scenarios
Using the wind farm import feature in Design > Wind farms you can now select the scenario from which you wish to import before selecting the wind farm to import in to the currently active scenario.
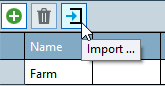
Bugs fixed
Alpha time series not calculating alpha below the specified low wind speed cut-off. We have updated our approach to how the 'Minimum Wind Speed For Fitting' value (default: 3m/s) is applied. Now this only applies when constructing the lookup table, not on constructing the alpha time series. This avoids step changes in frequency around the minimum speed in resulting wind speed frequency distributions for some sites.
Uncertainties and efficiencies
Duplicate wind speed uncertainty columns being added in 1.2.2
Energy Weighted Average Uncertainty not being calculated in 1.2.2
Calculated efficiencies not showing in Efficiencies table for upgraded workbooks when calculated efficiencies weren't checked in wake calculation settings
Fixed Efficiencies table left in unusable state after workbook conversion from .wow
Issues relating to missing SQLSpatial.dll in some installations:
Exception thrown when trying to download some external map or reanalysis data
'Method is not implemented' for some instances when running flow
Other bugs fixed
Can’t generate word report after cloning scenario
Crash when selecting "Calculation" in side panel after having been in the shear "Shear model setup" task
Flow calculation validation: Number of grids / discrete points incorrect
UI locks after visiting wind flow visualisation in workbook with no wind flow data
Max uncalibrated value reverts after saving changes to another mast's measurement's max uncalibrated value
Resource Panorama link ignores specified date ranges when downloading data
WindFarmer: Analyst 1.2.2 (2020-08-20)
Wind farm design scenarios
Scenarios allow you to store many wind farm designs within one WindFarmer: Analyst workbook, applying the same map data, wind analysis and flow calculations to all scenarios.
To manage and create new or cloned scenarios click the button in the WFA title bar. The button displays the name of the currently active scenario.
You can edit one scenario at a time in WindFarmer: Analyst.
The automation module now allows you to iterate through each scenario to update your analysis for all your wind farm configurations in one go.
foreach( var layoutScenario in Workbook.LayoutScenarios)
{
    Toolbox.ActivateLayoutScenario(layoutScenario);
    Scenario scenarioResults = Toolbox.CalculateEnergy();
}
New user interface layout
WindFarmer: Analyst now has an updated user interface designed to better reflect wind farm design workflows.
The chapters and tasks have been re-arranged. Motivations for re-organising the UI include:
- to suggest wind flow setup can be performed before layout design.
- to define a chapter structure we will expand over future releases
- to create separation between data that apply to multiple scenarios and data that are scenario specific.
A change to note is that the Wind chapter now includes tasks from the old Measurement, Cleaning and Reconstruction chapters.
We have improved the UI responsiveness on small screens and monitor display settings with increased text size (DPI) so you can always access all tasks:
New flow calculation process: Flow model target areas and better wind speed maps
The workflow for wind flow calculations has been altered to make it more suitable for wind farm design. You can now run a flow calculation before you place any turbines by defining flow model target areas and heights so that you may design your layout with reference to a mean wind speed layer.
The process is now as follows:
Firstly, choose your flow model type. Depending on whether you choose WAsP, simple flow or external flow will affect the required settings. For importing of external flow models most steps can be skipped.
For gridded flow calculations you must define where you wish to calculate the grid. Target areas are no longer linked to the initiation region. You also set the grid resolution on the flow field boundary.
You then define target heights before running the flow calculation.
There is now a new initiations task, separate task to flow model setup. Now when you run the flow calculation separate predictions are made using input data for each measurement site with available wind climate data. This means you can make changes to your initiation strategy without re-running the wind flow calculation.
After you make a change to an initiation region or adjustment region you can recalculate the resulting mean wind speed map layers by clicking the "Re-calculate mean wind speed map" button in the initiations or wind flow adjustment tasks.
The mean wind speed maps and the wind flow visualisation now fully respect the initiation strategy and adjustments: you see the wind speed that you would predict if placing a turbine at that location. In the wind flow visualisation task you see the relative wind speeds by direction. You will notice discontinuties in the flow field where the initiation strategy changes. These will be addressed in a future release where we look at wind flow blending.
Discrete wind flow predictions are made automatically at any existing turbine locations found in any scenario.
Note
Discrete predictions will be used in preference to gridded data.
Tip
Entering any neighbouring turbine locations before running the wind flow can be a good idea so you only need grids to cover your buildable area to save computation time.
Slope maps
Any workbook with gridded elevations will now include a slope visualisation. The slopes shown are the maximum slope in any direction and generated at the same resolution as your gridded elevations.
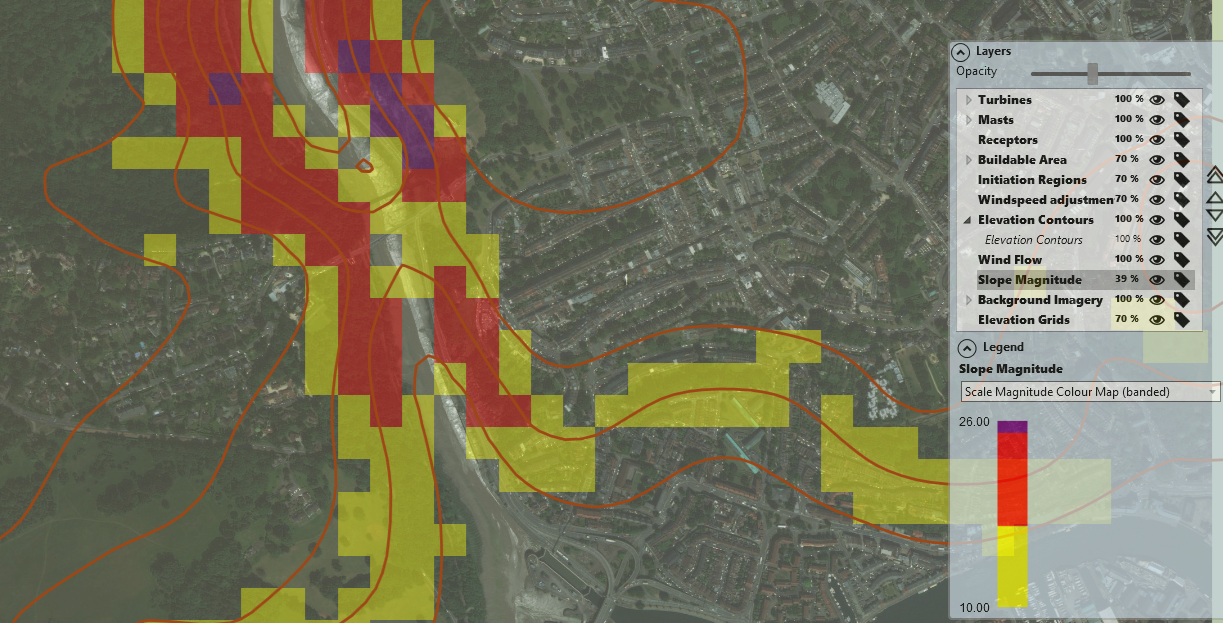
By default, slopes use the following colour bands.
| Max slope in degrees | Colour |
|---|---|
| 0 to 10 | |
| 10 to 17 | |
| 17 to 25 | |
| > 25 |
Other colour schemes can be selected in the legend. The default is a banded slope map, but a gradient option is also available.
It is not currently possible to edit the band settings.
Documentation website
You are now looking at our new help website! In 1.2.2 this is installed on your computer with WindFarmer, but we are working on a website version which will enable more advanced search features.
Check out the tutorials and theory manual.
Our intention is that in future all WindFarmer documentation and resources can be accessed from one website.
50% smaller file size for workbooks
Motivated by possible increases in project size in this release as you store many scenarios in a WindFarmer workbook, we endeavoured to shrink the workbook file size. Workbooks have been made significantly smaller by removing any cached data which can easily be re-generated. The actual size reduction after upgrade and save will vary greatly between projects depending on the amount of time series data, turbines and flow or energy calculations run.
This reduction will reduce file opening times significantly too by speeding up the time taken to make a local copy.
The following large data are no longer saved.
- Flow and performance matrices are exported after a calculation so needn't be stored in the workbook.
- Some time series data were cached in the workbook between sessions with calibrations and exclusions applied. This caching has been removed because it only had a small performance benefit but caused workbook size to increase significantly.
- Wind flow visualisation data. Now the wind flow review will only show as many flow cases as those modelled in the flow calculation rather than selection in the energy calculation settings (e.g. 12 rather than 180 sectors).
Air density extrapolation
The energy calculation first extrapolates the power curves to a reference air density and height, then makes corrections to this curve to generate power at each turbine hub height. If the difference between the reference air density and the turbine air densities was very large (e.g. height differences > 100m) then substantial errors could be introduced.
To make the WindFarmer air density calculation more robust and straightforward (given the scenarios paradigm) the user input reference air density and reference height is first extrapolated to the air density at the mean turbine hub height above sea level of all non-neighbour turbines in the active scenario. This extrapolated air density is used as the input to the energy calculation.
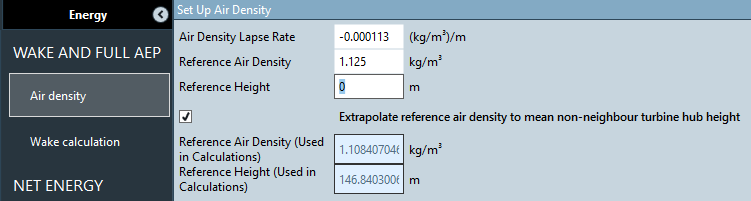
The mean turbine hub height air density is automatically updated when you switch scenarios.
If you wish to use the air density method in previous versions of WindFarmer you can uncheck "Extrapolate reference air density to mean non-neighbour turbine height". On workbook upgrade this setting is unchecked, for new workbooks the setting is checked.
Note
The reference height air density is stored in the base workbook and applies to all scenarios.
Turbine wind speed visualisation icon and label improvements
Turbines are now labelled with their hub height mean wind speed in all tasks and there is colour map visualisation of the wind speed within the turbine icon. You can enable and disable the visualisation and label using the layer manager.
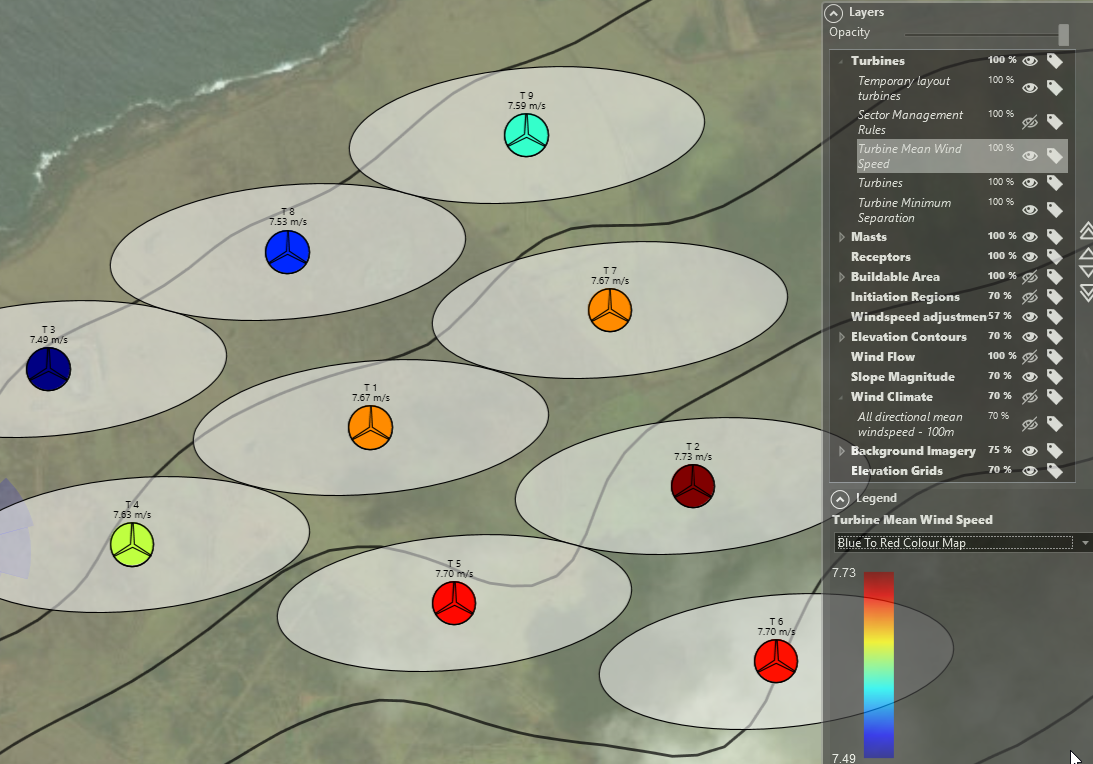
We have also improved our turbine icons:
- Turbine icons and labels are visible at all zoom levels
- Icons are perfectly centred on the turbine location
- The icon size is to-scale with the size of each turbine rotor diameter. We removed the superfluous rotor extents layer from the previous 1.2.1 release.
- Issues with the sub-layer ordering where you could struggle to see the sector management layer have been fixed.
Wind rose visualisation on the map
For any measurement site with an active frequency distribution you can now see a wind rose on the map! We display the uppermost distribution if there are multiple active frequency distributions at different heights on one measurement site.
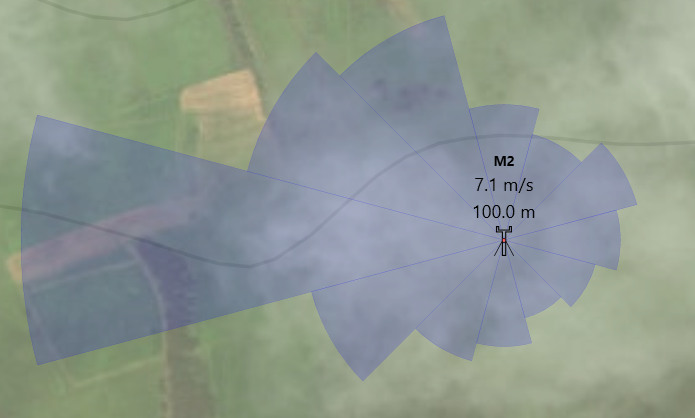
The mean wind speed for this frequency distribution is also now displayed as a label.
Faster grid layer rendering
Gridded data layers now render faster on the map as you zoom in and out. We have changed the interpolation settings so that you can now visually see the grid resolution.
Export a map image from a script
Toolbox.ExportMapImage(@"C:\mapimage.jpg",600,400);
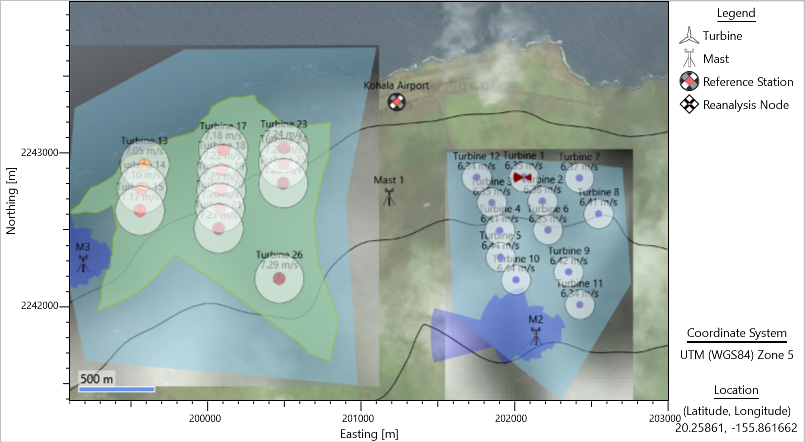
Single file installer
WindFarmer: Analyst is now installed from a single .exe file, rather than a .exe next to a "Support" folder.
Bugs fixed
83048 - ERA 5 data heights are incorrectly labelled as being at 100 m when they should be at 50 m
83077 - Simple flow model generates invalid Weibull parameters for some input FDs with low frequency sectors
RP Link bugs
83191 - Vertical Anemometers downloaded via the RP link do not allow negative wind speeds (they are classified as Wind Speed)
84296 - RP Link fails to download data with user's system time zone set to UTC +
Scripting and API automation issues
83398 - Calculate flow cases failure (initiation mode always assumed to be initiation region)
83072 - User needs to constantly dismiss the TI warning when running multiple times the energy calc in scripting
83052 - InitiationResource property is not filled if initiating resource in is sodar or lidar
83428 - Instrument model and manufacturer are not available through scripting or Python API
84337 - ReadOnlyWindFarm in scripting should have property saying if it was included in blockage or not
84340 - BlockageEfficiency is not farm specific so should not require the wind farm to get its value (change to interface)
Python API specific automation issues
84146 - Energy calculation no longer returns in API
84308 - Running time series energy from python API has different results than from scripting
83502 - Jupyter notebook to run energy calc does not seem to complete
Reprojection
84126 - Can't reproject when shadow flicker grid present
83904 - Can't reproject due to "Speedup_FreeStreamMeanWindspeed" file missing
Accessibility
83074 - Some tasks would benefit from having scroll bars
General UI issues
84946 - Splash screen on start-up blocks user activity for >25 seconds
76214 - Turbines appear to be inside buildable area in the map when very zoomed when they are actually outside the area.
83073 - Optimisation error not relevant for energy calc appears in the energy calculation page
83068 - Separation distance and rotor extents are not displayed after importing turbines from shapefile
83071 - Sector management layer seems to stay behind separation distance and rotor extents all the time
83004 - Sector management layer can't be set to the top layer
84018 - No legend labels for sensitivity curve
Dark theme issues
83344 - Display issues with fpm table in dark mode
53968 - Scripting messages log text not visible in dark theme
WindFarmer: Analyst 1.2.1 (2020-03-13)
Improved map performance
We have improved the zooming and panning performance of background images and elevation layers in the map rendering by fixing some issues in the way image tiles were cached.
Activate a software license in a single step
We have updated our licensing framework to make online activation of software licenses reliable. We can now provide a single product key by email which you enter to activate your license via a connection online, replacing a previous 2 step process.
New license activation installer
To set up network licenses efficiently we now have an installer for the license manager which can be installed separately to WindFarmer: Analyst.
Resource Panorama link re-enabled
The Resource Panorama (RP) link has been re-activated now the latest version of RP has been deployed which supports a newer authentication method. As a user you should notice no changes.
New scripting methods
Import locations from shapefile
You can now get an array of locations in the workbook co-ordinate system after importing a point shapefile in scripting. This allows you to generate masts, turbines, receptors or other locational objects.
Load contours from shapefiles
You can now import contour data in a variety of formats within scripting.
Bug fixes
Bug 82694:No long-term adjustment applied when calculating wind climate at measurement height
Bug 82963:Unable to generate shear or EPA report when unable to back calculate an overall alpha or z0
Bug 82628:Crash when Overall binning rule is specified in CreateFrequencyDistribution function
Bug 82633:Signal object has lost TimeSeriesType property
Bug 82851:Service/Framework error when interrogating for Wasp version in a script
Bug 82822:Loading contours errors on cancel
Bug 82795:WFA 1.2 crashes when converting wow files with comma decimal separator regional settings
Bug 82790:Cannot set displacement height of mast in scripting
Bug 80031:"Uninstall" missing in start menu when WFA is not installed in the default directory
Bug 82572:Object reference exporting TSV with no freq dist loaded in workbook
Bug 82649:Blockage intermediate results with time stamp is not very useful – remove time stamp
Bug 82707:Crash when right-clicking on exclusions in the cleaner where actual and proposed exclusions overlap
Bug 82598:Property WindFarmBlockageSettings.ManualSelectionOfIncludedWindFarms has strange behaviour on getting and setting
WindFarmer: Analyst 1.2 (2020-02-06)
Wind Farm Blockage efficiency prediction
All WindFarmer: Analyst users now have access to DNV’s Blockage Effect Estimation Tool (BEET) for estimating the wind farm blockage effect. The BEET calculates an overall efficiency to correct the long-held wake modelling assumptions that a turbine in the front (upstream) row of turbines will produce the same energy as a single turbine operating in isolation.
This wind-farm-scale blockage effect impacts all wind farm projects, both onshore and offshore. The magnitude of the effect will depend on several factors, including the turbine characteristics, the turbine layout/locations, and site-specific atmospheric conditions. It is the combination of these parameters rather than the onshore/offshore distinction that determines the magnitude of the effect. According to DNV’s current state of knowledge and depending on project-specific factors, previously unaccounted for turbine interaction losses related to blockage represent 0% to 4% of mean annual energy yield.
The BEET model was trained using results from 100s of full wind farm CFD turbine interaction simulations. The wind farm CFD model was developed and validated after several years of research by DNV, as described in the paper published in the scientific journal Energies in June 2018 https://www.mdpi.com/1996-1073/11/6/1609/ .

Additional resources:
Blockage Webinar, what non-technical people need to know: https://www.dnv.com/power-renewables/webinar/registration/wind-farm-blockage-2019-webinar.html
Points of clarification: https://www.dnv.com/news/wind-farm-scale-blockage-effects-points-of-clarification-161311
Running a Blockage efficiency calculation
Once you “Apply wind farm blockage model” the blockage efficiency will be calculated whenever you run the energy calculation.
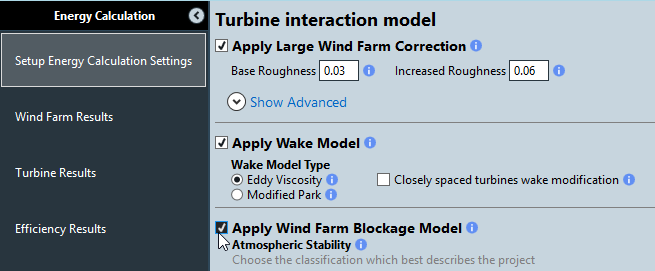
In the user interface the blockage efficiency result can be found in Efficiency results and it is included as a line-item in the Monte Carlo Net Energy calculated efficiencies table.
After running the Monte Carlo Net Energy simulation and exporting a report (or TSV results) you can find the blockage efficiency in the efficiencies table alongside the other losses.
Please note, the blockage efficiency is NOT included in the Full yield (the full yield is the yield including wakes, hysteresis and sector management output but no other losses output from the energy calculation). This is because blockage calculated via the BEET is at a wind farm level whereas Full Yield is calculated on a per turbine basis. DNV are actively researching ways to simulate blockage on a per turbine and direction basis and intend to include this more advanced model in a future version of WindFarmer.
Optimising with blockage: if “Apply wind farm blockage model” is checked the blockage efficiency is multiplied by the Full yield and used as the optimisation target. Please use this with caution: the BEET provides overall blockage efficiencies, not turbine specific values.
Guidance on Blockage model settings in WindFarmer: Analyst
The blockage calculation can be configured in the Energy Calculation Settings task.
Stability classification
The Blockage loss is greater for wind farms with significant stability. You should choose the classification which best represents your site.

Including nearby wind farms in the blockage calculation
On most projects you should use the default setting including all non-neighbour wind farms in the blockage calculation.
There is no explicit minimum distance for including neighbouring wind farms within the blockage calculation, but to consider including a neighbouring farm it should be quite close – the neighbouring projects basically need to be extensions of the subject wind farm (i.e. within about 1,000 m of the nearest turbine in your wind farms, in a location where you would expect them to modify the wind speeds in the front row in the prevailing wind direction).
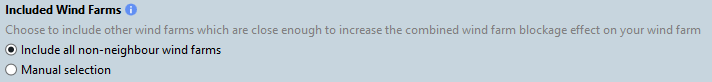
The Blockage efficiency calculation in more detail
Internal to the calculation, each run of the BEET calculation uses the following inputs. These inputs are derived in WindFarmer: Analyst automatically based on your workbook setup:
| Power curve | Taken from a turbine type and adjusted to the speed averaged over all the included non-neighbour turbines included in the calculation. |
|---|---|
| Thrust curve | Taken from a turbine type included in the calculation |
| Wind speed frequency distribution | Taken from a wind climate that initiates turbines included in the calculation and scaled to the un-waked hub-height wind speed averaged over all the non-neighbour turbines included in the calculation. |
| Layout | All turbines in the included wind farms define turbine locations input in to the BEET. |
For layouts with a mix of turbine types and initiating frequency distributions the BEET is run multiple times with one FD and turbine type per run for every turbine type-FD pair found within the set of input turbines. The results are combined using a weighted average, weighting by the full yield produced by the turbines with the turbine type-FD combination for the run. This pragmatic approach to calculating the blockage effect is used because the BEET was trained on homogenous turbine type wind farms with one turbine type and one representative frequency distribution.
To reduce the uncertainty in a blockage estimation, for unusual wind farm layouts or farms with a significant mix of turbine sizes DNV can perform Blockage CFD modelling. http://www.dnv.com/wind-cfd
If you use the BEET tool provided on the Renewables GeoPortal you can recreate the results from WindFarmer: Analyst by outputting the intermediate blockage results, which includes the input files for required by the BEET website tool.

Running the wind farm blockage calculation via scripting
// setting up blockage calculation to run within an energy calculation
// turn on blockage:
Workbook.ModelSettings.EnergySettings.CalculateBlockageEfficiency = true;
// for predominantly neutral or unstable set this as false:
Workbook.ModelSettings.EnergySettings.WindFarmBlockageSettings.SignificantAtmosphericStability = true;
Scenario results = Toolbox.CalculateEnergy();
double blockageEfficiency = results.Efficiencies.BlockageModelEfficiency;
// running the BEET calculation as a one-off calculation
double blockageEfficiency = Toolbox.CalculateWindFarmBlockage(fd, turbineType, Locations, intermediateResultsDirectory);
// Or also exporting intermediate results:
double blockageEfficiency = Toolbox.CalculateWindFarmBlockage(fd, turbineType, Locations, intermediateResultsDirectory);
Exclusion ellipses: Visualising the minimum turbine separation distance
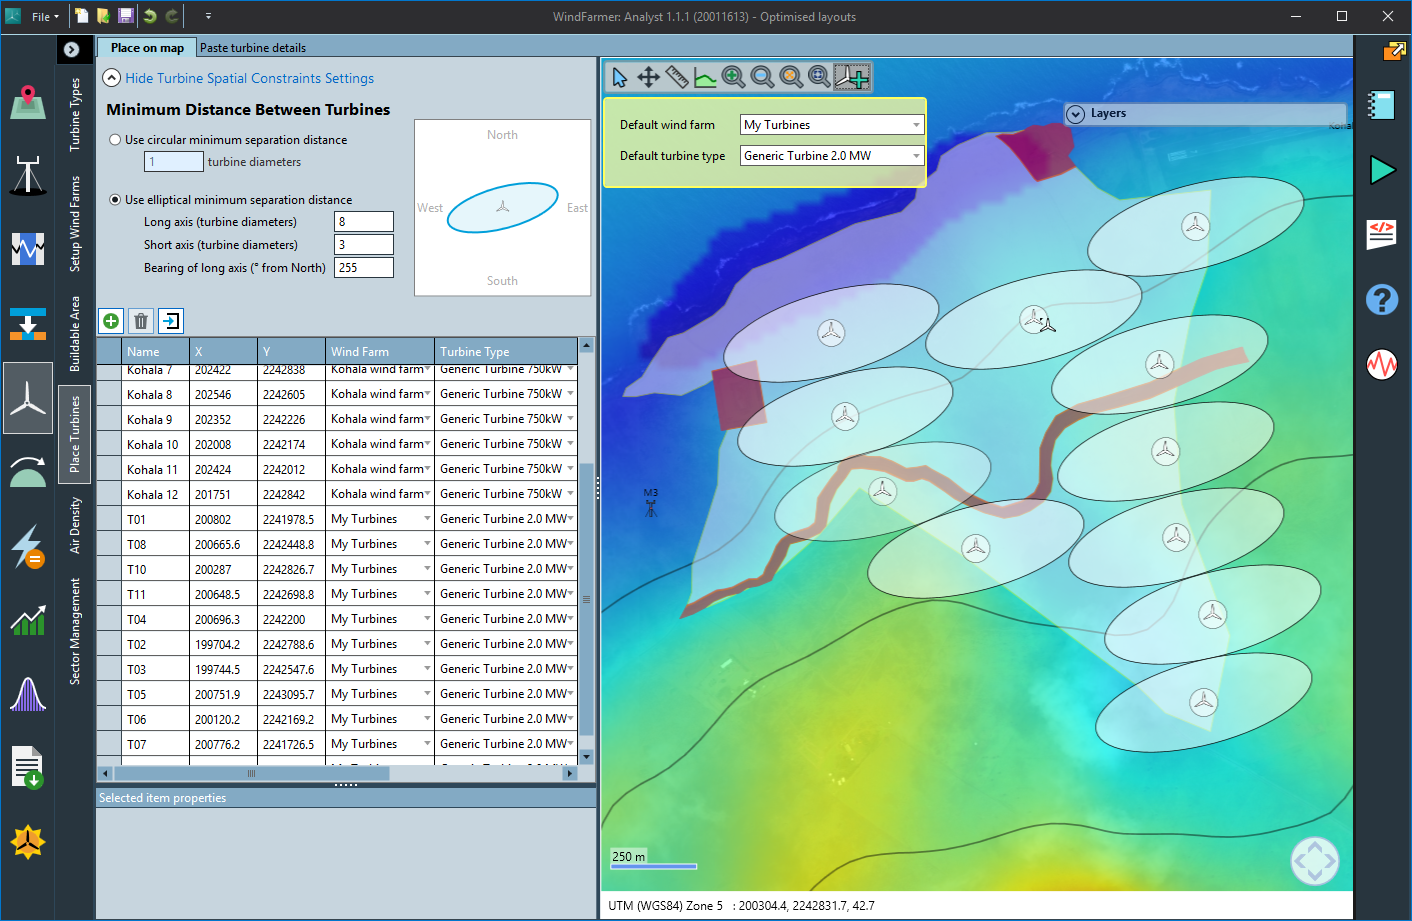
When placing a turbine, a minimum separation ellipse is shown to help you position the turbine with a sensible set back from others. The separation ellipse is shown as half the requested rotor-diameter separation: you should aim to ensure that ellipses don’t overlap. The rotor extents of the turbine is shown as a circle inside the ellipse too.
Note that the choice of turbine and wind farm for the next turbine you place has also moved to below the place turbines map toolbar and is visible when you select the turbine placement mode.
Better energy calculation setup and running
We have overhauled the energy calculation setup UI to add:
Better organised and clearer settings with info-tips describing each setting.
Better validation before and then when you run the energy calculation to direct you to errors and how to fix them. You now cannot run the Energy Calculation if your wind flow model or energy calculation settings are invalid. A multitude of error cases identified through user support are now caught before you calculate.
A progress bar and cancellation button visible in this UI.
Hidden advanced settings
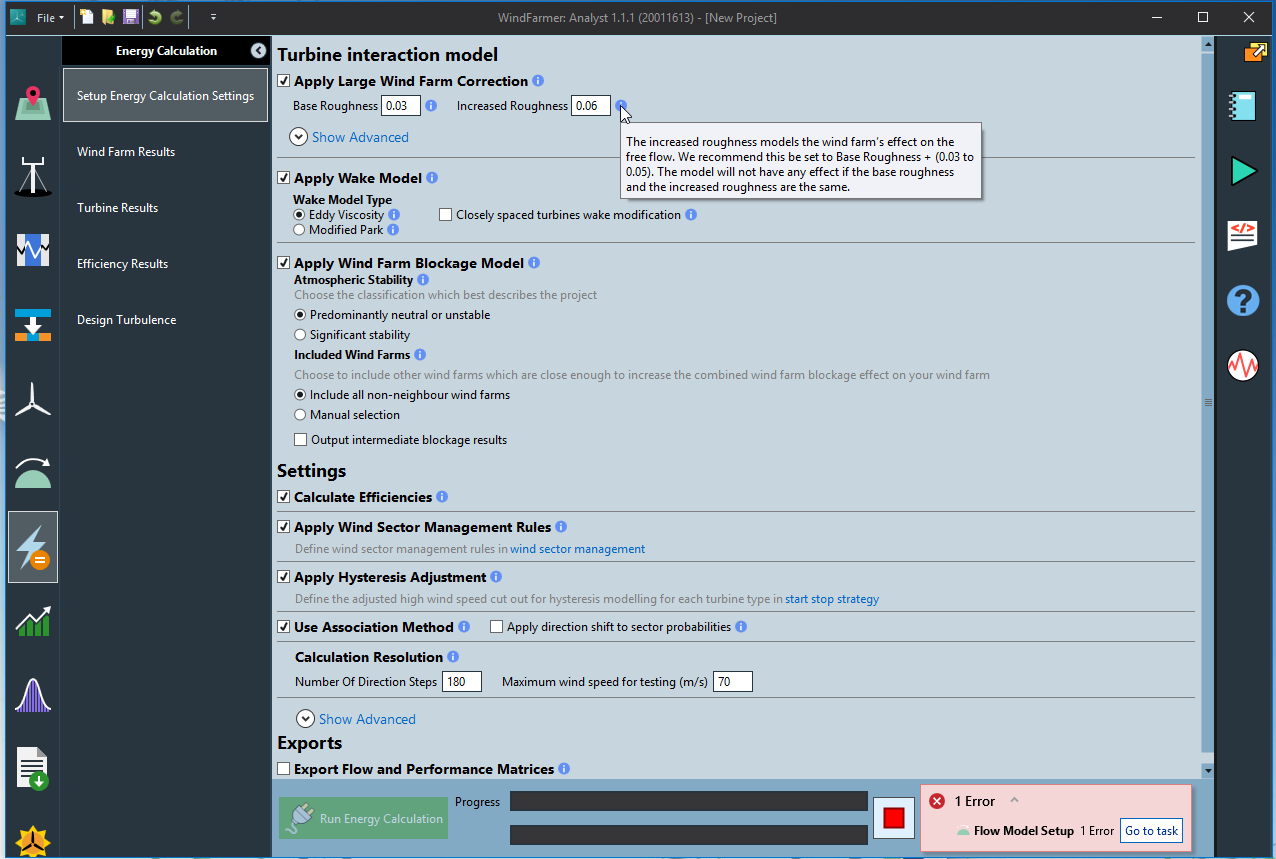
Long term adjustment now applied by scaling hub height frequency distributions to long-term hub-height wind speeds
We have moved from applying long term adjustments as a scale factor to applying adjustments by scaling to a target long term hub height wind speed, in line with DNV best practise. This is a more robust method because long term adjustments applied via scale factors are relative to only to the data used to derive them. They can be very wrong if applied to a frequency distribution derived from wind speed time series with different data coverage. Sometimes you can reduce uncertainty by deriving long-term measurement height wind speeds in the long‑term adjustment task using a different wind speed time series to that used to create the hub height wind climate.
To do this we calculate and store a measurement height long-term wind speed in the long-term adjustment task then extrapolate this to hub height using an effective overall alpha or Z0. A hub height frequency distribution is then scaled to the target long-term hub-height wind speed in the calculate wind climate task. The effective overall shear value which is calculated when extrapolating time series to hub height.
This method allows you to combine long term adjustments and shear in a simple way to robustly predict the long-term hub-height wind speed whilst still allowing you to create the hub height time series (and frequency distribution) using a more advanced time series shear approach to better predict the variations and hence energy content of the wind.
In the Calculate Wind Climate task it is possible to disable the auto-scaling to LTHHWS or override the target wind speed.
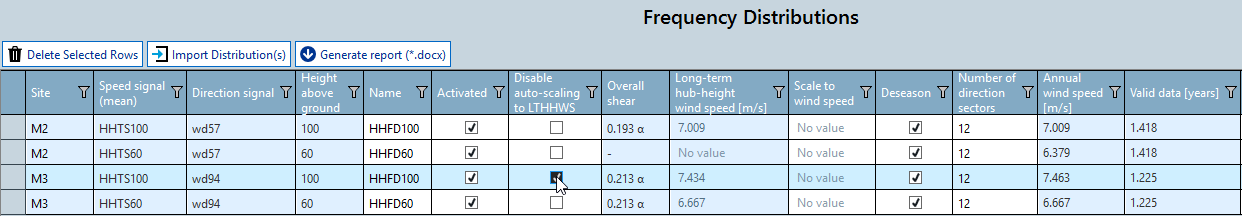
A detailed flow chart for this calculation is shown below, including 2
options where we either have an overall shear value in the shear model
and another where this is back-calculated. The equivalent process is
followed for log-law
calculations.
Because of this change we have been able to remove the warning when you selected PMC wind speed data in the on auto-setup of hub height time series.
Please note, these changes have changed the meaning of the overall shear value: for time series shear models where “Apply annual shear correction to time series shear model” was unchecked, the overall shear used to be the mean of all the time series shear alpha values. For these workbooks you will be warned that you should re-calculate the shear model when you open WindFarmer: Analyst in the new version, so that the saved overall shear value is brought in line with the definition of the effective shear discussed here.
Bugs fixed causing differences in numbers:
FIXED: Turbines generate wake at wind speeds greater than cut-out (Bug 31102)
A bug has been fixed whereby upstream turbines produced wakes when they are above cut-out. This could be seen in the flow and performance matrices but it has an insignificant effect on AEP.
Across our 17 stress test projects only 2 sites experience an absolute difference > 0.01% with a maximum discrepancy of 0.05%.
The impact on most projects is that turbines cut-out at slightly lower reference wind speeds, so the energy yield may reduce if this means a turbine becomes inactive for a simulated flow case and this is caught within the 1 m/s resolution of the wake simulation.
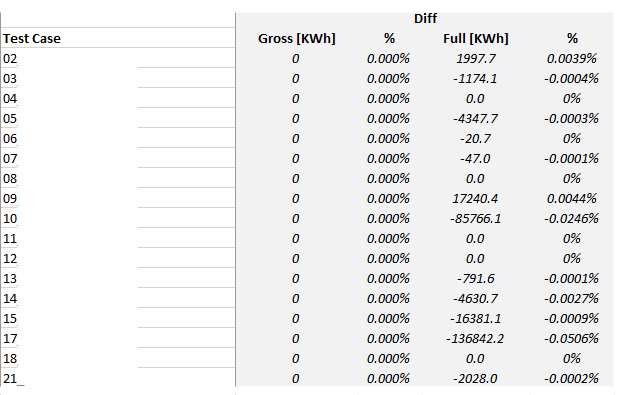
FIXED: ERA 5 inconsistency
The previous inconsistency in ERA 5 data due to has now been fixed after reprocessing our global data set. The inconsistency came from an interpolation method used to create the data. The values downloaded to will change slightly if you re-download the data in the Download Reanalysis Data task. You can then easily re-calculate long term adjustments with the new data.
FIXED: Monte Carlo Net Energy: Internal wake efficiency incorrect when farms excluded from the calculation.
We fixed an issue where the internal wake efficiency in Uncertainties was incorrect and mismatched with energy calculation efficiency results. This could occur when the workbook contained a non-neighbour farm that was excluded from the calculation.
FIXED: Export stats mean monthly direction is average of directions in degrees instead of the average of vectors.
Bug 81307
This effected the top table in the stats file where calendar month direction averages are presented and also the annual direction (mean-of-monthly-means) both in the stats files and in a number of places in the data reconstruction user interface.
This did not affect the monthly time series in the stats files or any resampled direction data.
FIXED: Long term adjustment investigations produce slightly different results with downloaded reanalysis data
Bug 81750
Some values which should match between investigations were slightly different. This was because the data downloaded from the online reanalysis data was time stamped at 30 minutes past the hour, at the middle of the time stamp period, and WindFarmer’s convention is to time stamp a time record at the start of the time period. We now adjust the time stamps of the downloaded reanalysis data to match WindFarmer’s convention.
Default setting for force through origin in Long Term Adjustment is now OFF.
Previously the default correlation setting for a long-term adjustment was to force through the origin. Now we do not force through the origin by default, in line with DNV recommendations. The default setting has been changed for new workbooks but not upgraded ones.
New automation methods and changes
Opening a workbook, new workbook
Toolbox.OpenWorkbook ( string filePath )
Opens a workbook (assumes discard already open workbook if not saved).
Toolbox.NewWorkbook ()
Opens a new empty workbook and discards any workbook which is already open.
To close a workbook when you have finished working with it in the API we recommend you call Toolbox.Save() or Toolbox.SaveAs(filePath) to save your work then Toolbox.NewWorkbook() to close this workbook and clear the lock file.
Define turbine specific manual adjustments in scripting
Workbook.Turbines["A1"].WindFlowAdjustmentMode.SetToSpeedupRegion();
Workbook.Turbines["A2"].WindFlowAdjustmentMode.SetToTargetWindSpeed(7.67);
Workbook.Turbines["A3"].WindFlowAdjustmentMode.SetToTurbineAdjustment(1.023);
Non-Generic overloads to simplify syntax and improve python compatibility
TimeSeries myTimeSeries = Toolbox.MeasurementCampaign.GetTimeSeries(
“M2~ws80~Mean”);

FrequencyDistribution myFD =
Toolbox.MeasurementCampaign.GetFrequencyDistribution( "M2~HH80FD" );

TurbulenceIntensityDistribution myWTI =
Toolbox.MeasurementCampaign.GetTurbulenceIntensityDistribution (
"M2~HH80WTI" );
Instead of
TimeSeries myTimeSeries =
Toolbox.MeasurementCampaign.GetTimeSeries<TimeSeries>(“M2~ws80~Mean”);

FrequencyDistribution myFD =
Toolbox.MeasurementCampaign.GetDistribution<FrequencyDistribution>(
"M2~HH80FD" );

TurbulenceIntensityDistribution myWTI =
Toolbox.MeasurementCampaign.GetDistribution<
TurbulenceIntensityDistribution >( "M2~HH80FD" );
Change to settings for turning off wakes
Please update your scripts if you have scripts which turn off wakes. We made this change to better reflect the approach in the energy calculation settings UI.
// Old method for turning off wakes:

Workbook.ModelSettings.EnergySettings.WakeModelType =
WakeModelType.NoWake;

// New method for turning off wakes:

Workbook.ModelSettings.EnergySettings.ApplyWakeModel = false;
Other changes
Import proposed exclusions from a file
In the clean measured data task you can now select a text file from which to import proposed exclusions which can then be reviewed, rejected or accepted and converted to exclusions. The format required for the file is the same as that you see when you export exclusions to file.
Apply directional frequency adjustments to account for direction shifts (UI)
It is now possible to apply a correction to the directional frequency of wind speeds at turbine locations to account for direction shifts in wind flow over the site by checking “Apply direction shift to sector probabilities” in the UI. This option is only available if you are applying the association method. Note, this feature was available in WindFarmer 5.3.
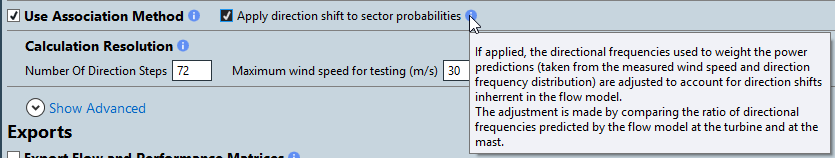
Flow model review
Flow model review now presents a better description of the wind climate and wind resource data on each measurement site which constitute your flow model.
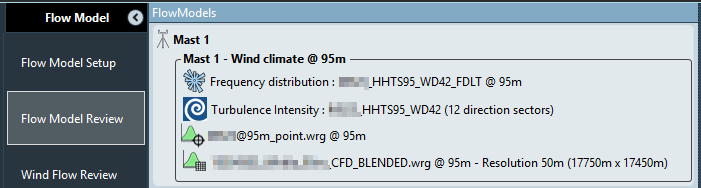
Better progress and error feedback in layout optimisation.
In line with the changes to the energy calculation page, Layout Optimisation now has a prominent progress bar, stop and error feedback.
We added more validation to the layout optimiser to check that you have gridded wind resource data to cover the entire buildable area at all the turbine hub heights of turbines which will move in the optimisation.
Other Bugs fixed
Flow:
77063: Changing 'Wind Flow Calibration' does not refresh the mean wind speed layers when no turbines are present
81152: Typo in WAsP advanced options
81673: Wind atlas flow calculation is attempted when file isn't specified
82407: Confusing error on running flow model: "Generation error… - There is no wind resource to generate."
Map:
80988, 60881, 81113: Gridded elevation to contour conversion now creates contours to cover the whole map rather than a specified area around the site centre, which was non-intuitive and could often lead to errors.
80870: User set opacity of multiple roughness layers isn't retained and is instead averaged on re-opening the workbook.
Data cleaner:
81272: Crash when deleting all proposed exclusions
Data loader:
80903: Cannot import *.wnd time series data
82155: Data Loader status message containing an error to help users diagnose data loading failures is not readable
Download reanalysis data:
82460: "API calls quota exceeded!" error when downloading reanalysis data: Our quotas have been adjusted to be per-user.
Wind analysis:
81297: If manual setup for calculating hub height time series failed for one mast it fails for all masts.
80969: Mean turbulence at 15 m/s is incorrectly reported for converted workbooks
81098: WindFarmer crashes on exporting stats for 10 day or monthly resampled time series
82360: Adding manual direction/speed reconstruction to existing reconstruction strategy appears as a blank screen
RP-link:
80953: Moving an RP mast location disables future downloads for that mast
Installer:
68404: Sentinal runtime installer "ok" pop appears on every installation
Automation bugs:
81018: ReadFromExcel fails when there are blank cells
Converting WindFarmer 5 wow workbooks:
81248: Wow converter fails to create valid turbine names on workbook upgrade
Optimiser:
82086: Optimisation fails when missing wind flow data for parts of the buildable area: now we check for wind flow across the buildable area.
82429: User must click refresh from scripts to be able to "Maximise Energy Yield"
82416: Optimiser settings updated by scripting not reflected in UI
Other:
81292: Selection in place turbines is broken after selecting item in manual adjustments
81294: Selection of turbines is preserved between workbooks
81334; Site location remains from the previous workbook when you open a workbook when displaying a task that is not map setup
82041, 82042, 82082: Various visual improvements to the long-term adjustment UI
WindFarmer: Analyst 1.1.1 (2019-11-31)
Online reference data download: MERRA and ERA5
WindFarmer: Analyst 1.1.1 provides a tool for rapidly downloading all the re-analysis data you need for your project. Select to download the MERRA 2 or ERA 5 time series you need from the 1, 5, or 9 closest nodes to your site.
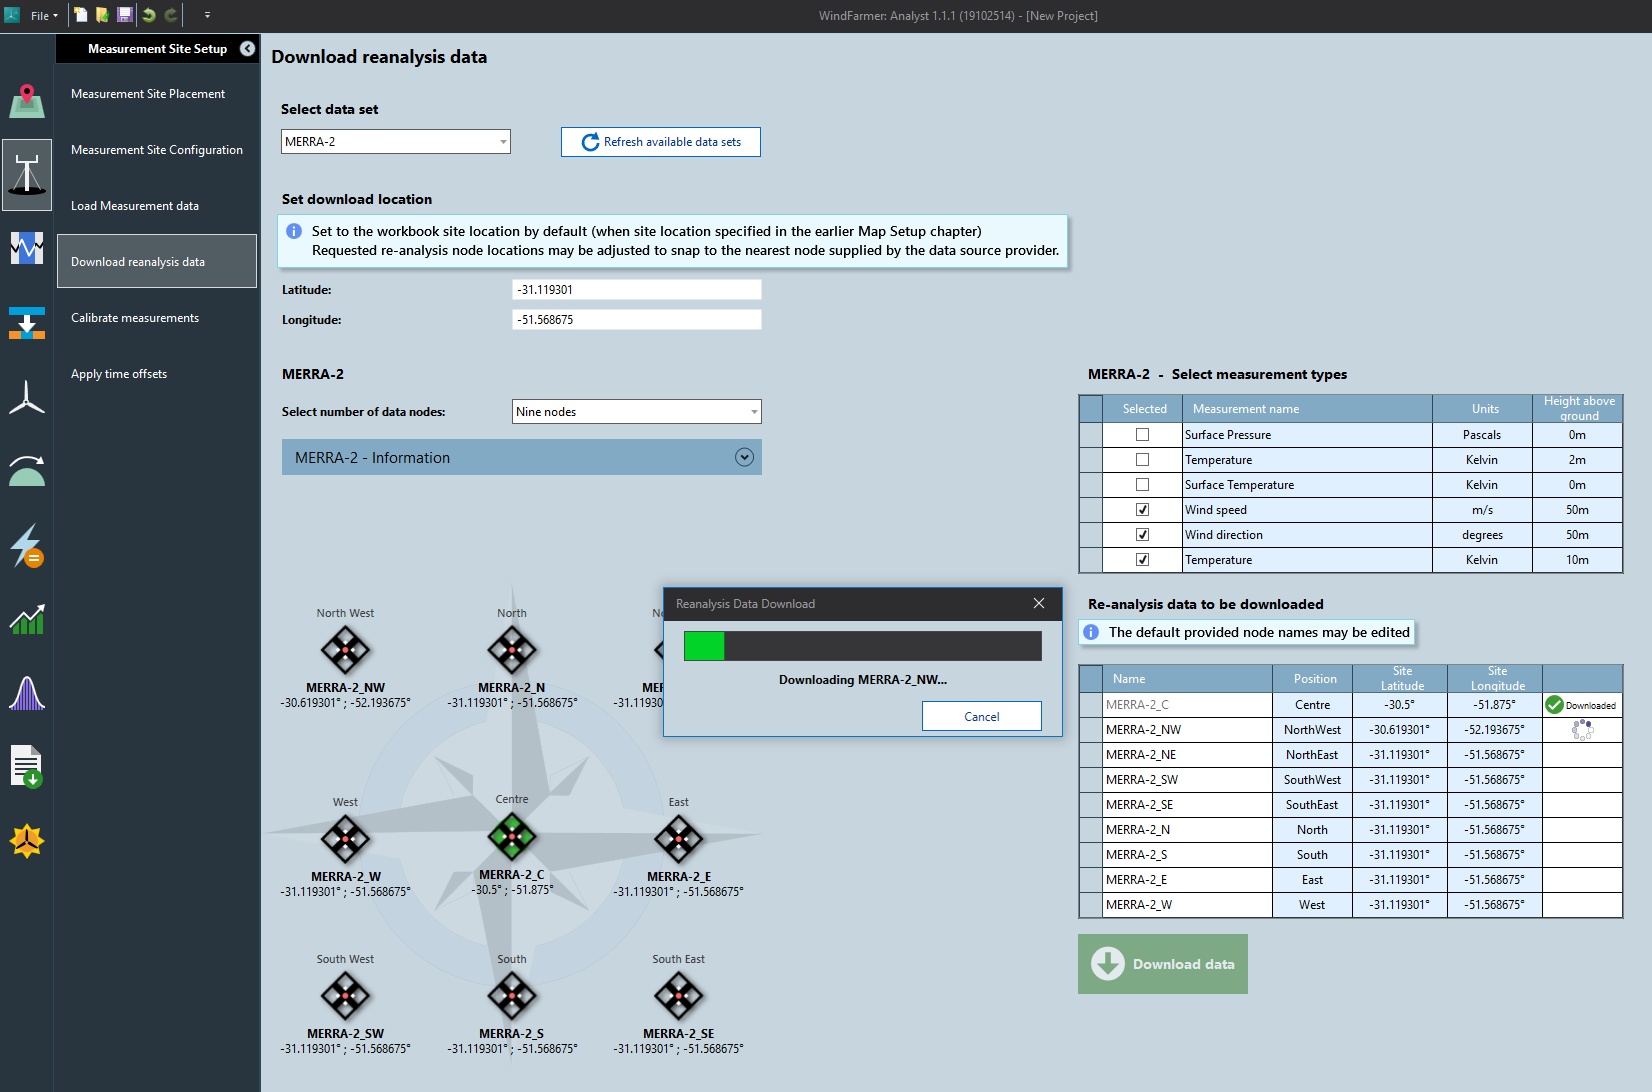
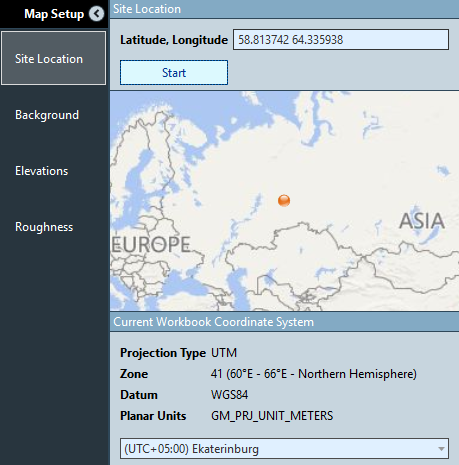
All WindFarmer: Analyst users with a valid Software License Agreement (SLA) have access to the reanalysis data service by logging in with their Veracity accounts. Please visit www.veracity.com to create an account if you haven’t already got one.
WindFarmer: Analyst sets the time zone of the project automatically from the site location. This workbook time zone is used to apply a time offset to the reanalysis data nodes downloaded to transform the downloaded data from GMT to the workbook time.
Known issue: ERA 5 data is currently being re-ingested in to our database for 2019 to correct an inconsistency in interpolation methods used to create the data in 2019 vs earlier years. We expect the values to change slightly after this re-ingestion in early 2020.
Manual wind speed adjustments by turbine
You can now change the adjustment mode for individual wind turbines. The manual adjustment and total adjustment are separated to make it clear how any global wind flow calibration is being applied.
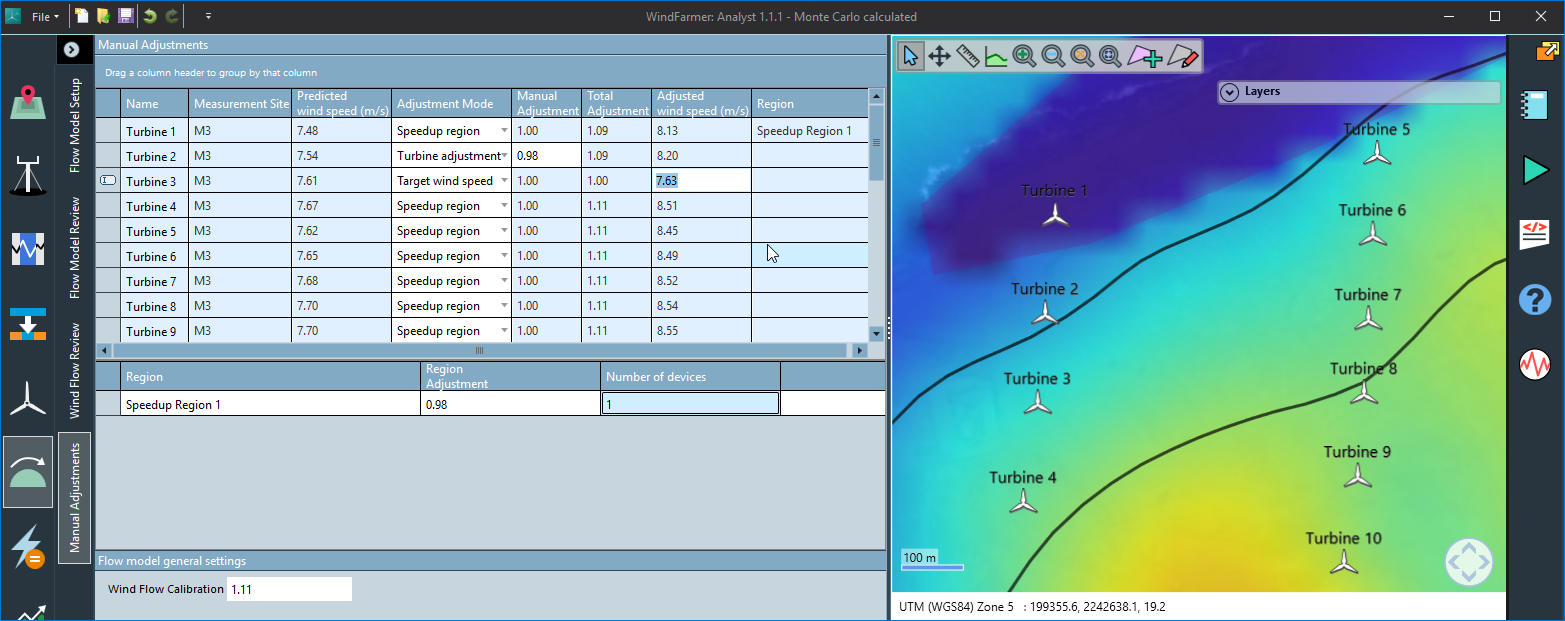
There are 3 options, you first select the adjustment mode then you can configure the appropriate settings:
| Mode | Behaviour | Flow calibration behaviour |
|---|---|---|
| Speedup region | Drawn region on the map allows you to adjust all turbine wind speeds within the region together. The wind climate layer updates to show the altered wind speeds within the region. | Adjustment multiplies by flow calibration to create total adjustment. |
| Turbine adjustment | Manually specify wind speed adjustment for a specific the turbine. | |
| Target wind speed | Type in the target mean wind speed for the turbine | Flow calibration has no effect: you have over-ridden the target wind speed. |
In general, wind flow adjustments are handled in a more consistent and robust manner. The wind flow calibration now applies as part of the displayed “total adjustment” and it is also now possible to apply turbine specific and regional adjustments when NOT using the association method. Previously only the wind flow calibration worked in the non-association method energy calculations.
Roughness file import
We have a new roughness task from which you can import, review and delete roughness layers. Roughness is now displayed in a separate map layer.
Roughness is accepted in the WAsP .map format. You can import roughness in a .map file which is combined with elevations in either the roughness or elevations task.
A .map file containing both elevations and roughness will be split after import and displayed as separate map layers. Note if you want to delete both roughness and elevation contours after importing a combined map you must delete the 2 layers separately.
Software licensing
Software licenses are now available for WindFarmer: Analyst! We can offer both local or network software (e.g. digital product key) or hardware (dongle) licenses.
To apply or transfer a software license please see the documentation on our customer portal.
Software licenses greatly speed up the admin time for delivery of new licenses and software evaluations.
Monte Carlo Net Energy
Monte Carlo Net Energy was first release in WFA 1.1 – see the release below for more information. WindFarmer: Analyst 1.1.1 includes the following improvements on the original release:
Reporting of wind speed uncertainty inputs
The wind speed uncertainty inputs are now reported in the energy assessment word report.
The wind speed uncertainty in the long-term reference period “2b Variability of reference period” is derived from the interannual variability in the wind speed.
| M2 | M3 | |||
|---|---|---|---|---|
| 60m | 100m | |||
| [%] | [m/s] | [%] | [m/s] | |
| Measurement accuracy | ||||
| 1a Instrument accuracy | 2 % | 0.1294 | 2 % | 0.1505 |
| 1b Measurement interference | 1 % | 0.0647 | 1 % | 0.0752 |
| 1c Data quality and metadata | 1.5 % | 0.097 | 1.5 % | 0.1128 |
| Long term measurement height wind climate | ||||
| 2a On-site Data Synthesis | 0.123 % | 0.008 | 0.05 % | 0.0038 |
| - 2b Variability of reference period | 3.8891 % | 0.2515 | 3.1754 % | 0.2389 |
| 2c Correlation to reference station | 2.6 % | 0.1682 | 1.5 % | 0.1128 |
| 2d Consistency of Reference Data | 1.5 % | 0.097 | 1.5 % | 0.1128 |
| - 2e Wind frequency distribution - past | 0.6708 % | 0.0434 | 0.6708 % | 0.0505 |
| Vertical extrapolation | ||||
| 3a Extrapolation to hub height | 0 % | 0 | 0.5 % | 0.0376 |
| Spatial extrapolation | ||||
| 5a Model Inputs | 5 % | 0.3234 | 4.5 % | 0.3385 |
| 5b Horizontal Extrapolation | 5.5 % | 0.3557 | 6 % | 0.4514 |
Default efficiencies and uncertainties
New workbooks now include default line items and suggested value ranges in the notes for efficiencies and wind speed uncertainties. By default, all truncations are off.
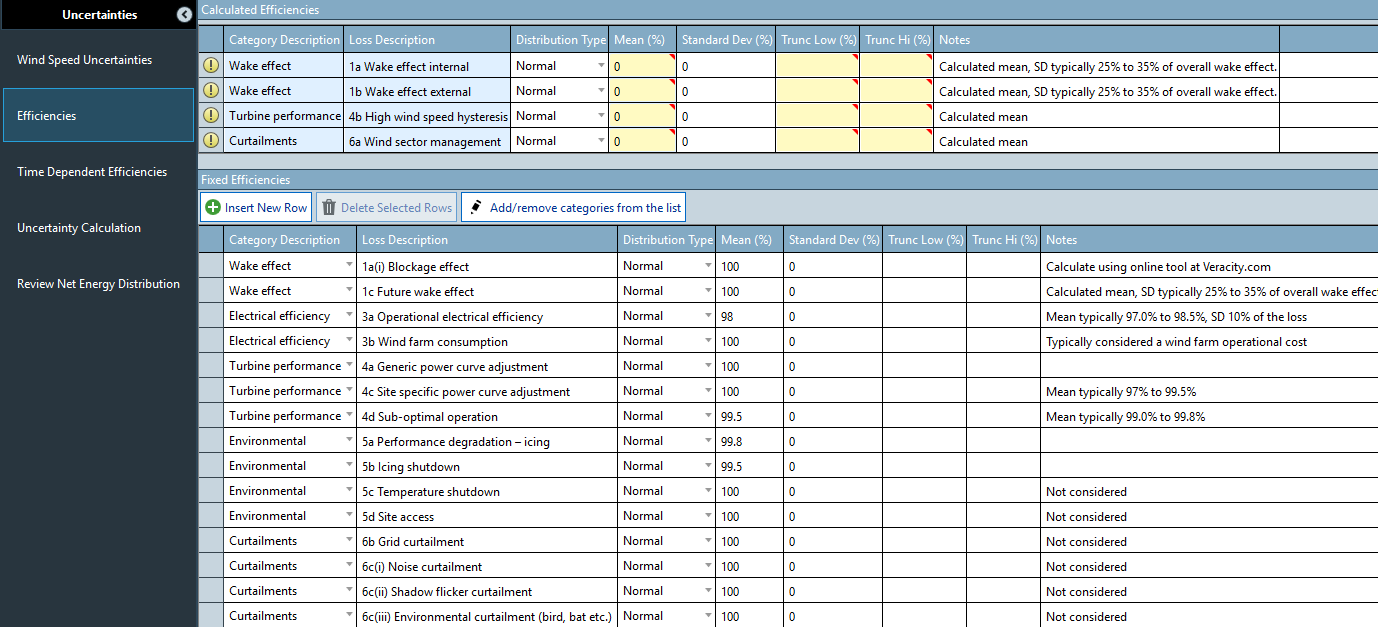
Validation of values
Sensible validation rules are now applied to help users enter valid truncations, means and standard deviations for efficiencies.
Other Changes
Turbine name uniqueness improvements
In WFA 1.0.5.1 we relaxed restrictions on turbine name uniqueness so that turbines within separate farms could have the same name (a lot of farms have turbines named T1, T2, T3…). This had some unintended consequences which have been addressed in this release. We have re-instated the automatic unique naming of new turbines placed on the map and new turbines created by pasting in or importing turbine locations without a name.
Bugs fixed
Bug 80538: Crash when generating Wind Climate report when Measurement tree is shown in the side panel
Wind flow model bugs fixed:
Bug 80477: Manual flow model adjustments are set to Wind Flow Calibration when workbook is saved, closed and reopened
Bug 51740: Flow calculation with WAsP 11 is much slower than with WAsP 10
Bug 78068: Wind Flow Review state issues: reference wind direction doesn't update as expected
Bug 80227: Cannot run flow model when turbines in different farms have the same name
Bug 79645: Turbine initiation region visually still assigned after having deleting the region
Bug 80546: Creating initiation regions no longer defaults to mast contained in the region
Bug 81265: ”Range action actions are not supported” error when auto generating initiation regions
Monte Carlo:
Bug 79938: Review Net Energy Distribution task presents results in kWH/yr, not GWh/yr
Bug 79759: Values copy-pasted in to uncertainties on wind speed table are multiplied by 100
Bug 80430: Chaining scripts together to create a workbook and another to run energy and net energy produces NaN at the end
Bug 79934: Empty Net energy output table is reported when MC is not calculated
Bug 80984: Error when generating EPA reports when Monte Carlo Net Energy has not been run
Long term adjustment:
Bug 79971: Applied long term adjustment formatting in calculate wind climate task is inconsistent with LTA views
Bug 79911: Long term adjustment plot correlation best fit line always goes through origin regardless of force through origin setting
Bug 79782: LTA TSV Export Resampling period doesn't show number of days when using N-Daily greater than 1
Bug 79918: LTA Auto-setup default selected windspeed for long term mean wind speed is not correct when no reconstructed wind speed available.
Bug 79953: Default averaging period selected in auto setup is monthly - 10 days is a consistently more accurate choice.
Other bugs fixed
Bug 81266: Object reference error when creating a HHTS when there is no shear model defined
Bug 79883: Unable to load wot file with comma as decimal separator when computer uses German settings
Bug 79846: Installer for WindFarmer is not signed
Bug 79970: Automatic data cleaner, clean-by-value: Between condition disables OK button if first value lower than second
Bug 80452: RP Link: calibration end dates incorrect for measurement with > 2 sensor replacements
Bug 78055: Labelling for time series shear plot has 2 "Shear alpha" lines
Bug 80606: Pasting 3 columns of data where the 1st is blanks makes WF unresponsive and names are not auto-filled
Bug 79964: Contour layer z position in layer manager doesn’t seem correct
Bug 80888: Data cleaner crashes on attempting to close empty scatter tab
Bug 81252: Row selection in Load measurement data isn’t clear
WindFarmer Analyst 1.1 (2019-07-17)
This landmark release includes a user interface to take you from ingesting or downloading raw time series, through wind analysis all the way to P90 Net energy predications.
Throughout the development of your wind farm project you will have to update your wind resource assessment multiple times. Once your assessment is configured in WindFarmer: Analyst you can rapidly recalculate each step of the calculation chain to update your net energy predictions in response to new inputs.

New features which create this end-to-end calculation chain include:
Download your data from Resource Panorama to kick start your analysis from cleaned, calibrated and documented time series measurements. Later use the link to update your analysis with new time series measurements.
Wind analysis user interface: Rapidly perform data reconstruction (MCP), long term adjustment, shear and long-term hub-height wind climate prediction through a user interface with auto-setup analysis that investigates all options.
Monte Carlo Net Energy simulates 500,000 possible wind farm net energy outcomes to build a net energy distribution and predict the annual P99, P90, P50 net energy yields and other statistics needed for financial modelling. The model robustly combines losses and uncertainties described by probability distributions to enable modelling of asymmetric effects such as availability to increase the accuracy of P99 estimates.
Resource Panorama link
If you use the Resource Panorama measurement campaign monitoring service, when starting a project you can now download Measurement Sites with a few clicks. This maintains full traceability of all settings entered in Resource Panorama and you can later come back and download the latest measurements to update your analysis.
The Resource Panorama link downloads:
Raw time series data
Calibrations
Exclusions
Full measurement campaign history (which can be used to auto-generate the EPA-ready report)
All instrument properties and changes.
Mounting arrangements
Logger details
You will require a Resource Panorama account to log-in and use this feature.
Wind analysis user interface
In the wind analysis User Interface we follow a top-down approach. You can very quickly run a best practise analysis then review detailed reports and fine-tune your strategy:
 |
Start here in each task. Auto-setup selects the default best-practise options based your data and settings. Every possible combination of options is analysed saving lots of investigation time on projects with more datasets. |
 |
Produce visualisations (correlations, synthesis checks, wind roses etc.) and detailed tabulated results to review the strategy and results. |
 |
Use Re-calculate whenever an input changes from an earlier stage of the calculation chain. Re-calculate all quickly updates all results calculated within the task. Re-calculate will not change your existing settings. |
 or or  |
Custom configuration if you need to select inputs not selected by the auto-setup. (e.g. Reconstruction of a non-primary measurement, or using non-primary height options from other measurement sites). |
 |
The measurement tree: The output time series is automatically saved in the workbook under calculated signals under each mast. Time series can be exported to as time series or stats files, or visualised with ctrl + click then select view signal. |
Data reconstruction
Data reconstruction is all about maximising the on-site data coverage of measurements, typically at 10 minute resolution.
Direction reconstruction
Auto setup for direction reconstruction generates direction reconstruction options for each measured reference direction time series. Auto setup then prioritises options by distance from the input direction time series to reconstruct and any option that can’t add records, given the splicing order, is excluded.
Generate report allows you to review the correlations, detailed statistics (e.g. direction offsets) and a comparison of the measured vs. synthetic direction time series.
Parallel measurement combination
Parallel Measurement Combination creates a combined wind speed output from 2 wind speed measurements at the same height on a Mast. Mast wake effects are removed in this process.
The mast effects are removed by specifying the boom orientation of each wind speed measurement used plus the exclusion width. During auto-setup the boom orientations defined in the earlier Configure Measurement Site are selected.
Generate a report to visualise the mast effects and exclusions so you can edit them if required.
If your boom orientation changes substantially within the course of the measurement campaign you can split the parallel measurement combination in to multiple periods and specify boom orientations and exclusion widths appropriate to each.
Speed reconstruction
Auto setup for speed reconstruction is analogous to that for direction reconstruction, except that reconstruction options are prioritised by wind speed synthesis uncertainty: the lowest uncertainty option that adds data is used first.
Generate a report to review scatter plots, detailed statistics (e.g. correlation slope, R2), and a wind speed frequency comparison.
Long term adjustment
Auto setup to investigate all long-term adjustments predicted by all
the reference stations and re-analysis nodes in your workbook. Review
the results and select the adjustments you wish to include in your final
long-term adjustment to carry through to the wind climate
calculation.
Calculate shear
See the notes under WFA 1.0.3 for details on Calculate wind shear.
Review annual / overall shear alpha values predicted by shear model (UI)
You can now compare the effective alpha for the calculated time series shear model to the annual shear model predicted alpha.
The effective alpha is a single alpha value back-calculated from a
comparison of the mean of monthly means of the hub height time series
and time series to extrapolate we use this in our EPA reports to
characterise the time series shear model in a single value.
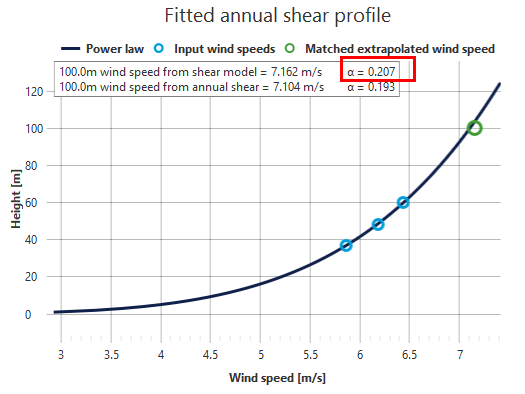
Calculate hub height time series
Use the auto-setup to generate a hub height time series on each measurement site with a shear model at each hub height using your time series shear model and reconstructed wind speed time series data. Use the manual setup to specify different extrapolations.
Calculate wind climate
This task allows you to rapidly the create long-term hub-height frequency distributions and hub-height turbulence intensity distributions that will be needed for flow and energy modelling.
You can edit any properties of the distributions after they have been created.
Settings index:
| Activated | You can have one activated distribution at one height on one measurement site. Activation means this frequency or turbulence distribution will be used in flow and energy calculations. See how the wind climates detailed on the right go green when turbulence intensity and frequency distributions are activated for a height. |
| Number of direction sectors | Enter any value you like but note that it is advised to use something which is a factor of either 360 or 180 sectors (e.g. your setting to be used in the energy calculation). Note that the maximum that can be used by WAsP is 36 sectors. |
| Valid data [years] | The amount of wind speed data that went in to the distribution, including records where no direction data were available. |
Frequency distribution specific settings:
| Applied long term adjustment | This is set in the Long-term adjustment task and shown here for transparency |
| Scale to wind speed | Specify an absolute wind speed to scale the frequency distribution to. |
| Deseason | Reflects whether seasonal bias is removed from the distribution. If there is a calendar month of data missing then de-seasoning is impossible and it is impossible to apply this setting |
| Annual wind speed | Deseasoning = true: Analogous to the Mean of Monthly Means. This is the Mean wind speed derived from the overall wind speed frequency distribution, which in turn is derived from the days-in-month weighted combination of the monthly frequency distributions stored in WFA. Deseasoning = false: analogous to the arithmetic mean. |
Turbulence specific:
| Wti binning format | When activating the distribution, the turbulence data is averaged in to a binned look-up table that is used in the energy and design turbulence calculations. |
| WTI minimum wind speed bin centre cut off | Wind speeds below this value will not be included in any mean-over-speeds turbulence metric. |
| WTI minimum record substitution threshold | If a bin has less than this number of records the mean turbulence value is substituted for the overall mean turbulence. |
Wind climate reporting
When generating reports from the UI in the Calculate Wind Climate task you can see wind rose and turbulence visualisations for all distributions or selected distributions. The colours of the new wind rose have been optimised for grayscale printing.
 |
 |
|---|---|
Improved turbulence intensity plots
Turbulence Intensity Comparison report
Extra turbulence intensity distribution comparisons are available at the bottom of the report. There is an overall then a calendar month comparison.
| Monthly turbulence distribution plots | ||
|---|---|---|
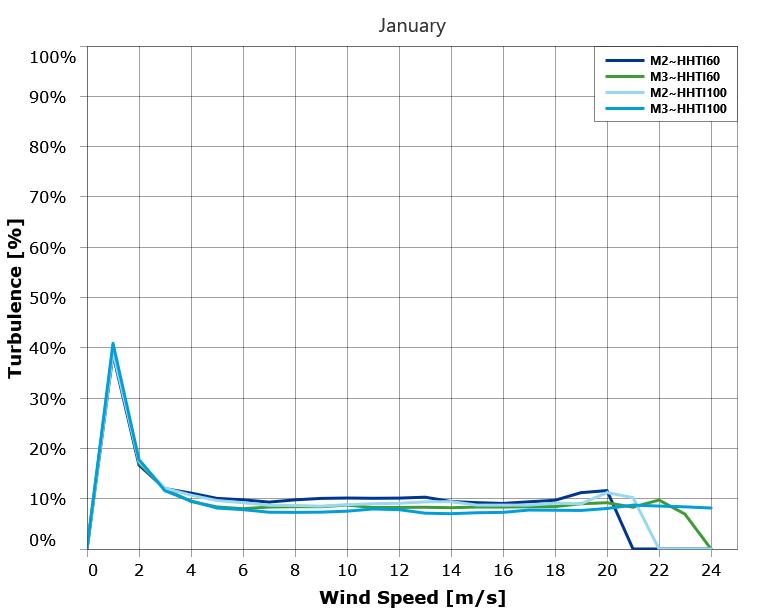 |
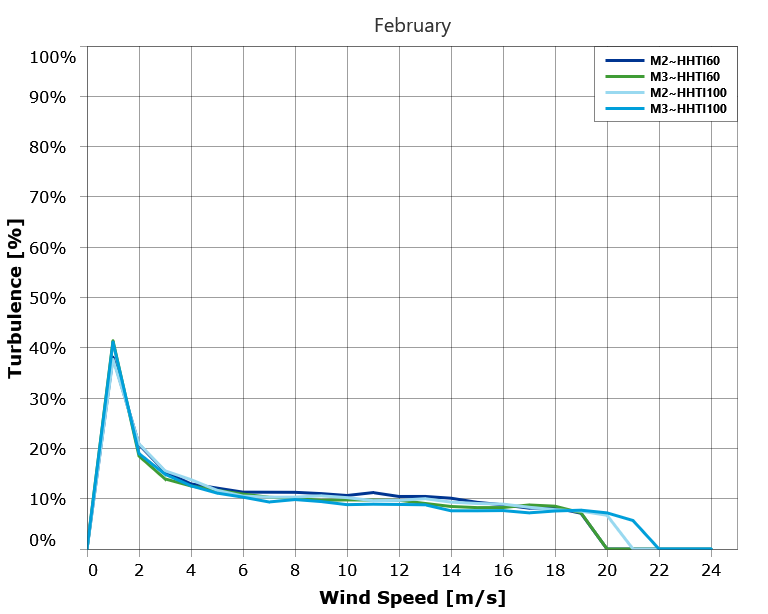 |
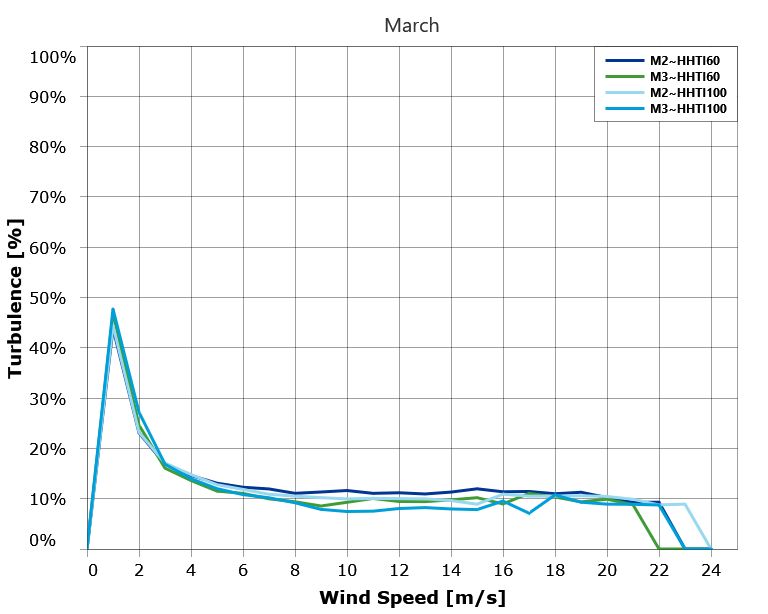 |
The measurement tree
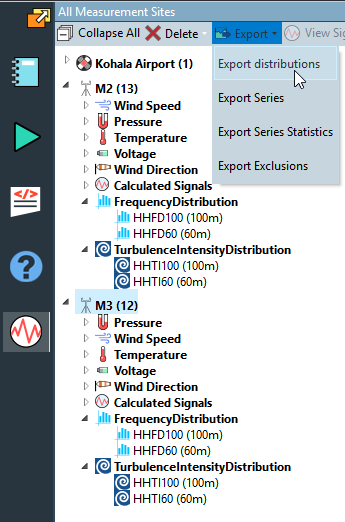
Export frequency and turbulence intensity distributions to file from the UI
You can now export 1 or more distributions from the measurement tree on the right. You can select the mast then export all distributions in one go to a chosen folder. You may also export multi-selected distributions or a single selected distribution. Distributions are exported with the settings defined in the Calculate wind climate task.
Export time series statistics from the UI
Export time series statistics allows you to rapidly export a single file to see coverage for mast. Stats are only derived for mean signals.
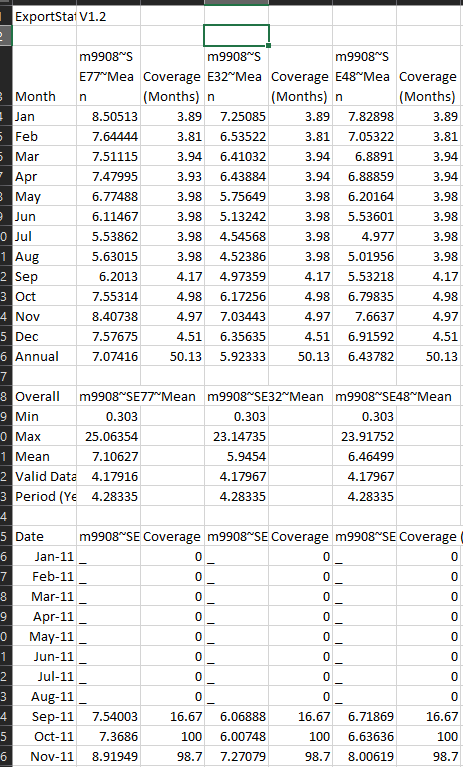
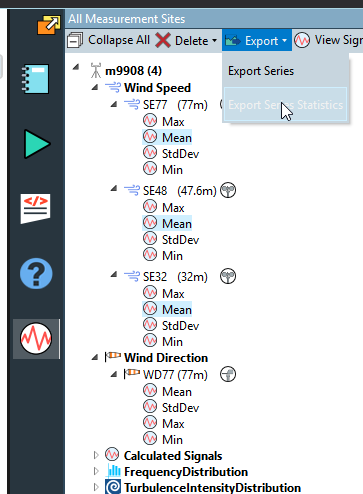
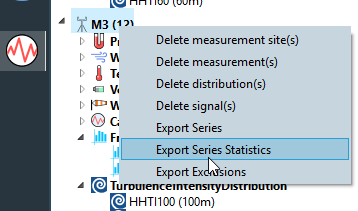
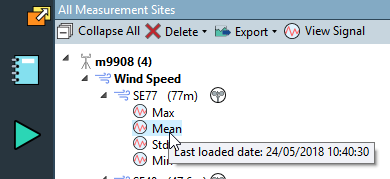
Last modified date set on a measured time series when data loading
The last calculated date is also viewable against calculated time series in this view.
Auto setup logic
The following flow chart details the optimisation and filtering performed by the auto-setup tools in each data reconstruction task described above.
In the above diagram Synthesis is defined as:
Step 1: Correlation of between an input site and reference time series.
Step 2: Transforming the reference time series using the regression model generated such that it is a prediction of the site.
Monte Carlo Net Energy
In DNV we use a Monte Carlo simulation for combining losses and uncertainties. During this model we typically model 500,000 possible future wind farm energy production outcomes are to build a net energy distribution. The inputs to this model the uncertainties and losses are all defined as distributions so you can define the uncertainty in each loss factor, maximum possible loss factors.
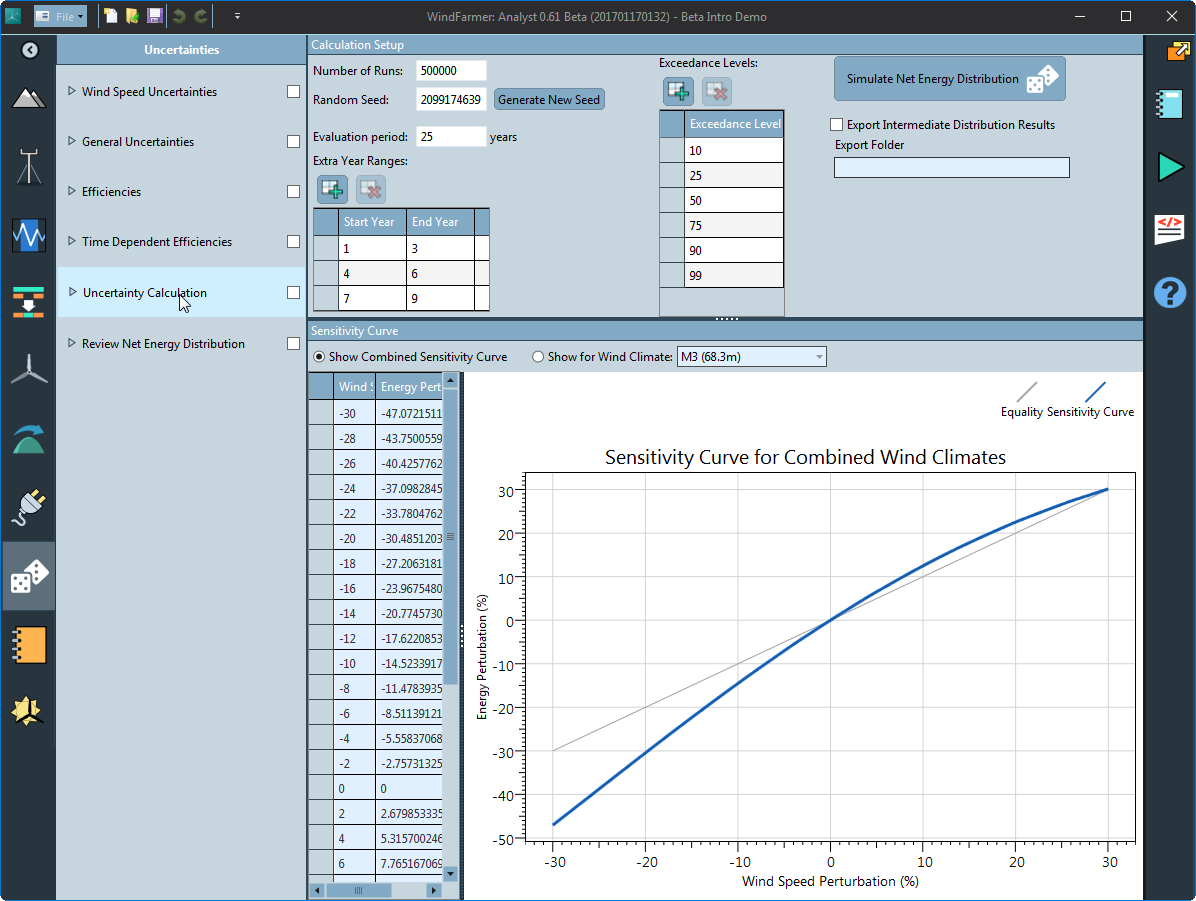
To predict each simulated energy production case we generate sample of random numbers with the properties of each input uncertainty or efficiency (loss) distribution independently. A value from each distribution is combined across the effects together to predict a possible Net yield.
The Monte Carlo Net Energy calculation can simulate the impact of non-linear effects such as availability and wind speed to energy sensitivity.
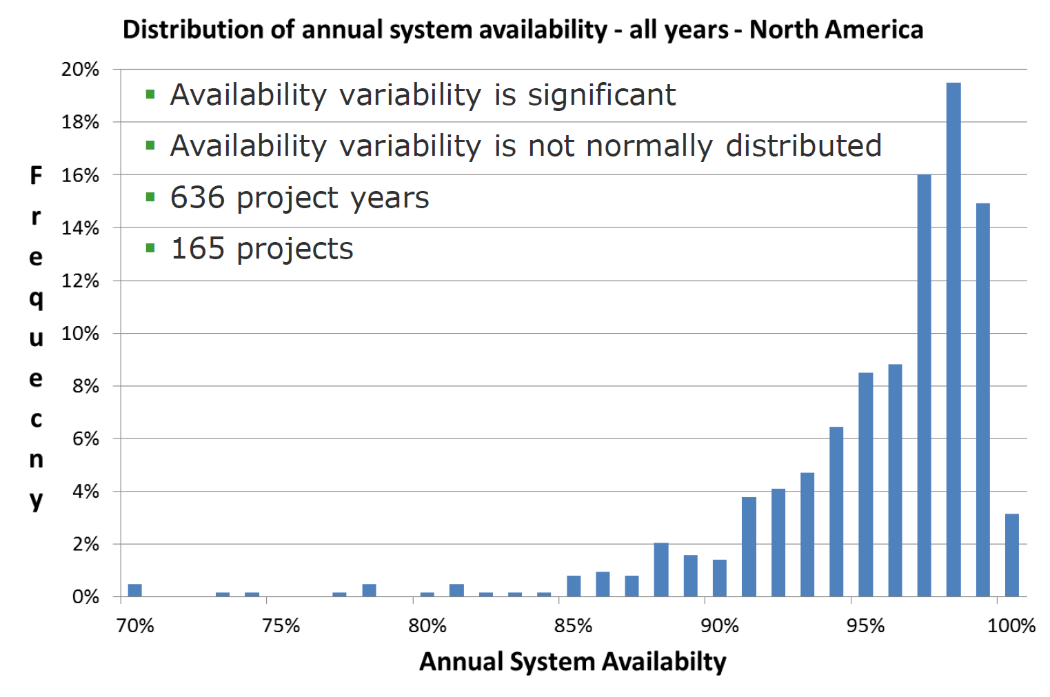
Wind speed deviations from wind speed uncertainties are combined then converted to energy before propagating through the model. The conversion factor is via a sensitivity which provides the wind speed perturbation to energy perturbation conversion. This curve flattens off at higher wind speeds, like a turbine power curve. Traditional assumptions of a sensitivity ratio, or straight-line wind speed-to-energy conversion factor get this relationship wrong. WindFarmer: Analyst derives this sensitivity curve specifically for your project within the wake and energy modelling so the exact curve will depend on a number of factors including the power curve and the frequency distribution.
For availability the distribution has a long tail as a small subset of projects seriously underperform. It is clear that availability is not a normally distributed so we can’t use simple assumptions to combine the uncertainty in availability with other uncertainties. We commonly model availability as a Weibull loss distribution.
The impact of none-linear effects is generally to skew our net energy distribution. Typically the result is a longer downside tail.
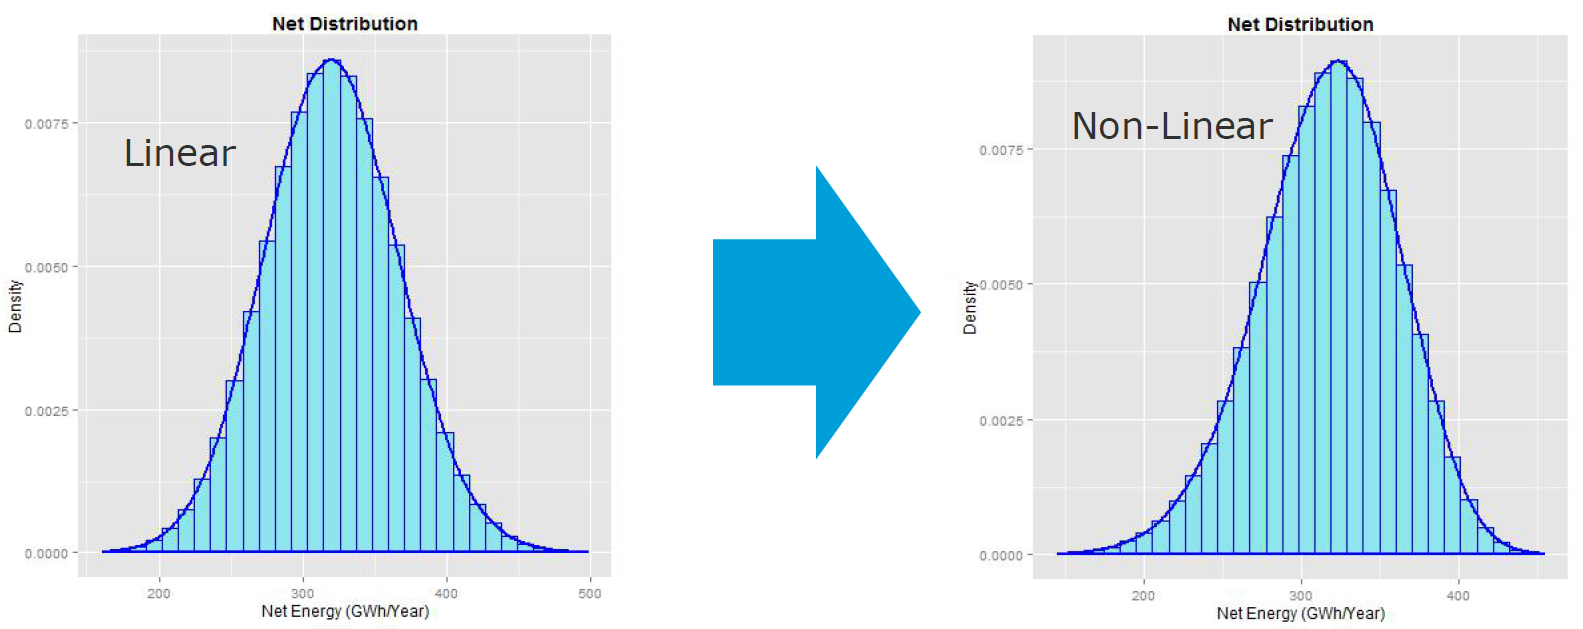
Monte Carlo Reporting
A new section has been introduced to present the results of the Monte Carlo Net Energy simulation and the executive summary has been adjusted also.
Energy Assessment Summary
| Project Summary | |
|---|---|
| Wind farm | My Turbines |
| Turbine type(s) | Hawaii 2.0 MW |
| Turbine hub height(s) [m] | 100 |
| Turbine rated power(s) [kW] | 2000 |
| Number of wind turbines | 14 |
| Total installed capacity [MW] | 28 |
| Wind Resource Summary | |
| Average hub-height air density [kg/m³] | 1.1207 |
| On-site measurement period [years] | 20 |
| Long-term reference period [years] | 3 |
| Average wind turbine hub-height wind speed [m/s] | 7.6479 |
| Energy Assessment Summary | |
| Evaluation period [years] | 20 |
| Lifetime P50 Gross Energy [GWh/Year] | 87.2013 |
| P50 efficiencies | |
| - Wake effect | 81.3853 % |
| - Availability | 96.5 % |
| - Electrical efficiency | 97.5 % |
| - Turbine performance | 98.4545 % |
| - Environmental | 98.1378 % |
| - Curtailments | 95.5382 % |
| - Other | 100 % |
| Total losses | 70.6849 % |
| Effect of asymmetric production | 99.9977 % |
| 20-year P50 net energy production [GWh/Year] | 61.6367 |
| 20-year P50 net capacity factor | 25.1119 % |
| 20-year P90 net energy production [GWh/Year] | 45.6271 |
| 20-year P90 net capacity factor | 18.5893 % |
| 20-year P90 / P50 uncertainty index | 74.0258 % |
| Net Energy Output | ||||||
|---|---|---|---|---|---|---|
| Wind farm [GWh/annum] | 1 yr avg (90%) | 1 yr avg (75%) | 1 yr avg (50%) | 20 yr avg (90%) | 20 yr avg (75%) | 20 yr avg (50%) |
| My Turbines | 42.6461 | 51.5437 | 61.491 | 45.6271 | 53.1392 | 61.6367 |
Clarification of Gross, p50 Gross, Full and Net yields
To disambiguate the results of the Energy and Wake calculation and the Monte Carlo Net Energy Calculation we have introduced 4 annual yields. These can all be viewed in the TSV outputs (Turbine Results.tsv and Wind Farms.tsv)
| Calculated from | Description | |
|---|---|---|
| Gross | Energy and Wake | The Gross yield is a theoretical energy output of the turbines in free stream conditions in the absence of any wake effects (see note1 about large wind farm effect) or other losses. Factors modelled include air density correction of the turbine power curves and wind flow modelling to predict the wind turbine location wind climates. |
| Full | Energy and Wake | The Full yield is the energy yield predicted by the WindFarmer wake and energy model. Depending on your calculation settings, in addition to the modelling within the gross yield prediction, it includes modelling of wakes, wind sector management and high wind speed hysteresis. |
| P50 Gross | Monte Carlo Net Energy | The Gross yield after accounting for uncertainty in the wind speed inputs to the wake and energy calculation. Note that because of the asymmetric nature of the wind-speed to energy sensitivity curve the P50 Gross is not equal to the Gross. The P50 Gross is the Gross yield value at which 50% of possible future wind farm energy outcomes are above the value, and 50% are below the value. |
| (P50) Net | Monte Carlo Net Energy | Net yield is reserved for the outputs of the Monte Carlo Net Energy calculation which accounts for all losses and uncertainties. Different “P” exceedance values can be drawn to understand the uncertainty. The P90 is the energy production at which 90% of possible wind farm energy production outcomes exceed the value. |
- WindFarmer 5.3 included the large wind farm correction in the gross yield. We now have the option to run the “Efficiencies” calculation in the energy calculation settings. When this is checked WindFarmer: Analyst will run multiple energy calculation variants with different settings in order to estimate the calculated efficiencies (high wind speed hysteresis, internal wake effect, external wake effect, wind sector management). When the efficiencies calculation is run you get the true gross yield with no large wind farm correction.
Other features
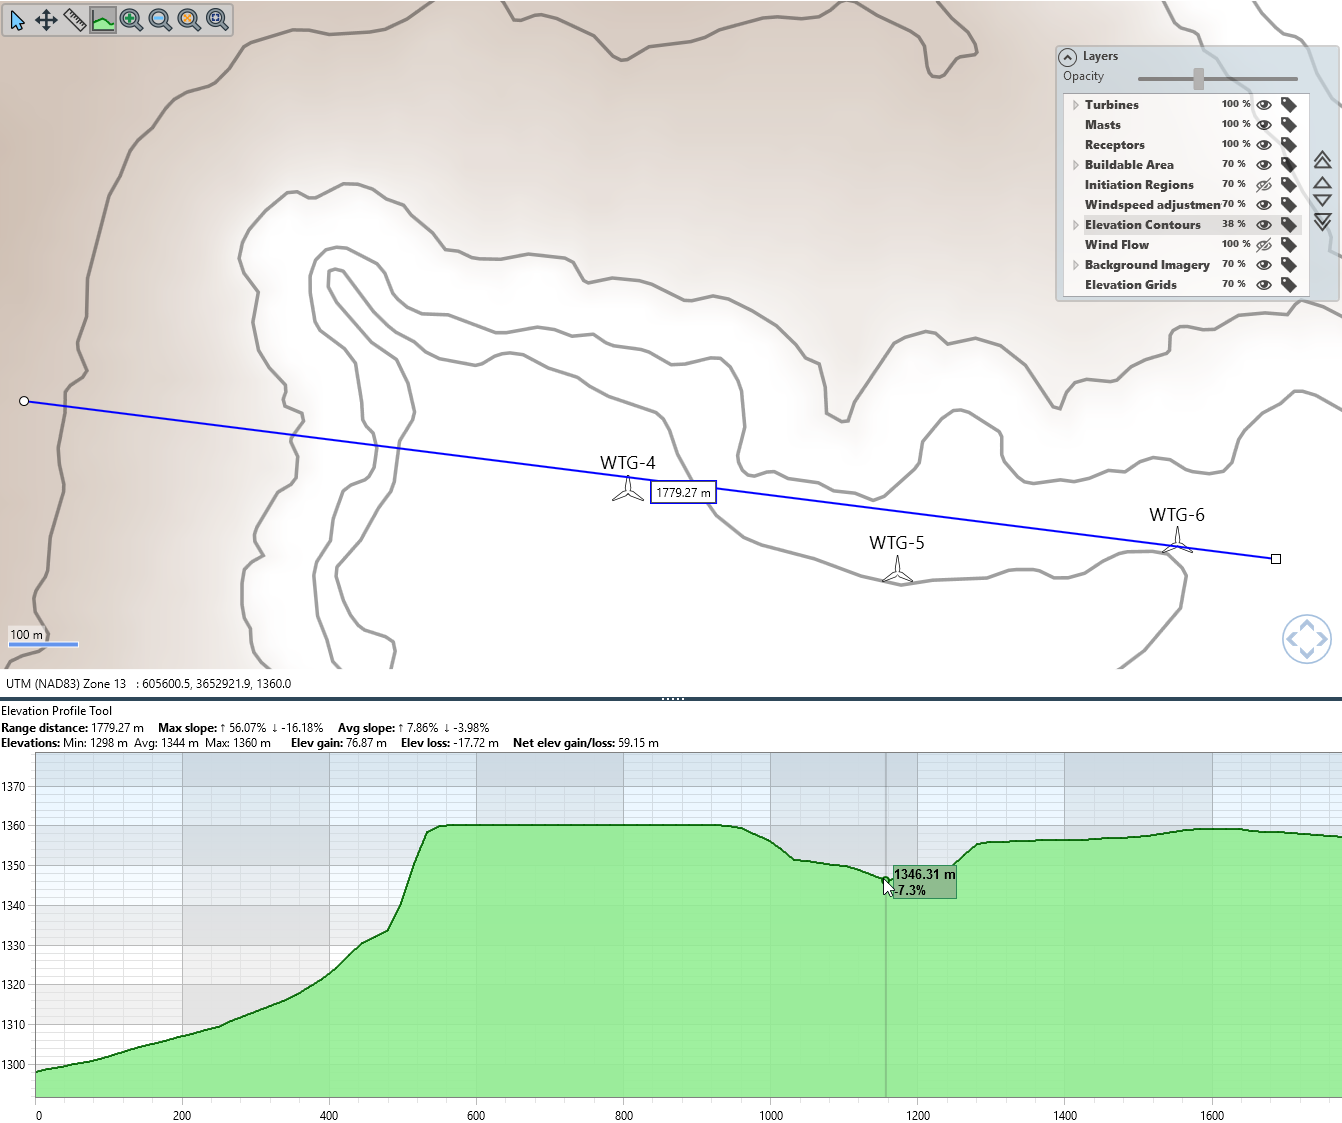 Elevation profile tool
A benefit of sharing our code base with our sister product, SolarFarmer!
We now have a terrain slicing tool for analysing elevation profiles along a line you draw on the map.
We intend to extend this tool in future to show the wind flow layer to help inform wind flow model adjustment and blending strategies.
Programmatically access directional Weibull A, k and frequency for point and target wind resources
Access to flow model results has been added to enable extraction of data needed for TR6 EPA reporting.
Import multiple scripts in one go
You can now multi-select scripts and user libraries to import from the scripting editor.
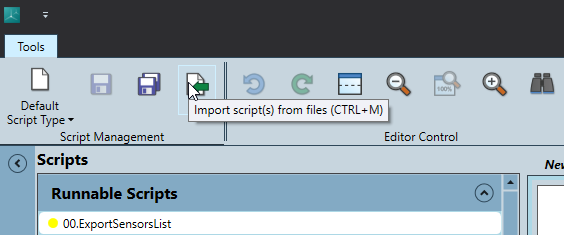
Export exclusions to a text file
You can now export all exclusions or the selected exclusions to a file from the data cleaning, exclusions tab. Exported exclusions have time offsets applied: the exported file corresponds to what you see in the data cleaning UI.
Faster global map
We now have a better site-location wizard and global map that utilises Bing Maps.
Flow model improvements
Improved mean wind speed layer
The overall wind climate layer is now:
- Shown and updated after a gridded flow model calculation completes
Preserved after re-opening a workbook
Re-calculated on editing wind flow adjustments or wind flow calibration
Visible in all tasks
Several other flow model issues have been fixed (see bugs below).
Initiation modes to improve wind farm import and wow file upgrade robustness
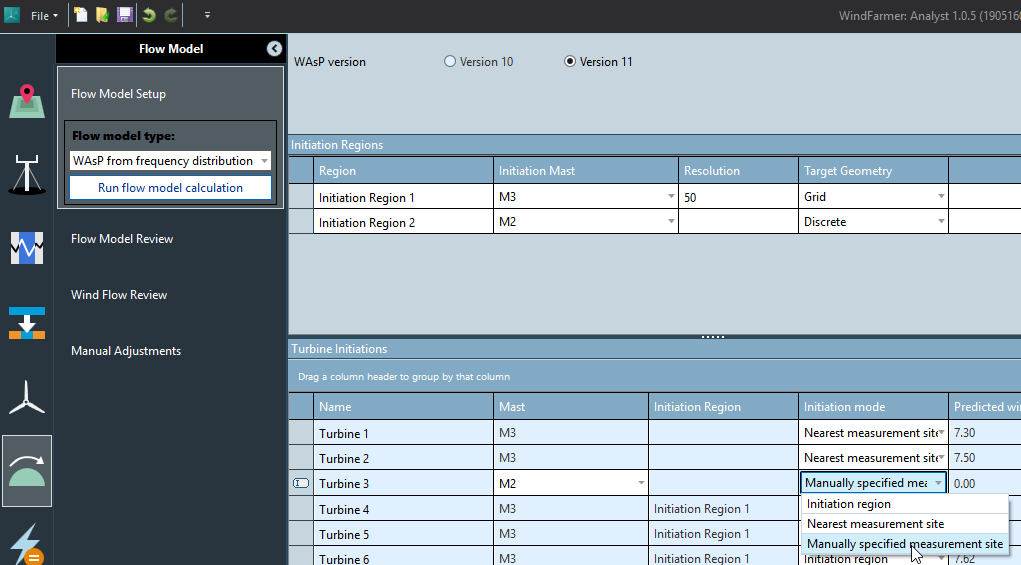 You can now
select an initiation mode for a turbine. If you select “Manually
specified measurement site” or “nearest measurement site” this overrides
any initiation regions drawn on the map.
You can now
select an initiation mode for a turbine. If you select “Manually
specified measurement site” or “nearest measurement site” this overrides
any initiation regions drawn on the map.
When you import a wind farm from another workbook all imported turbines use the manually specified measurement site which is set as the initiation measurement site from the donor workbook. The same is true for WindFarmer 5 .wow file workbook upgrade. This makes import of old flow data and neighbouring turbines more robust.
WAsP 11.6 support
WAsP released a new version of WAsP installed via WAsP Suite which broke compatibility with WindFarmer: Analyst. WindFarmer: Analyst now works with the latest WAsP 11 version.
High precision WRG and RSF support
We now support tab separated wrg and rsf files with high precision. Previously the WAsP defaults for these outputs limited the precision. This increased precision allows for more accurate usage of our CFD flow model results.
Bugs fixed
Frequency distributions with calendar months with no records can be de-seasoned
When generating frequency distributions in scripting, if deseason is set to true and some months do not have any data incorrect overall frequency distributions could be generated. Now we have WFA throws an exception to warn the user that they can’t de-season in this case because there is not enough data.
Energy results differ after de-activating and re-activating a FD saved from scripting
77259: This bug is serious consequences but is very unlikely to have affected anyone. If you created and saved frequency distributions via scripting, then de-activated the distribution and later re-activated the same distribution you got different results after the second activation. This was due to a normalisation issue from the normalisation factors for each month of the stored distribution not being saved.
Flow model bugs fixed
77521, 77658, 77659: When finding flow model data for a location the first dataset first within a 2m threshold is selected, not the closest.
This probably hasn’t affected any projects but could have caused small differences if you had multiple layout options with locations that differ by <2m in the same workbook for comparison purposes.
73894: Generated wind climates are not found for turbines with non-zero displacement height when initiation region is present
73892: Wind climate data are not found for turbines with non-zero displacement height
59194: Wind climate data not shown in Wind Flow Review for imported wind farms
76974: Wind Flow layer in Wind Flow review disappears after changing height
69392: WindFlow layer in Wind Flow review is not on top even though it is listed as top
74916: Wind flow layer in Wind Flow review is at the bottom on the map but on the top in layer manager
76061: FlowModelReview 'Generated' tooltip says STRING NOT FOUND
76062: Running flow calculation from side bar outside of flow views does not refresh the climate layers
Other bugs
78832: Unknown error HRESULT: 0x800AC472 when writing to excel from a script. (Often when using OneDrive)
77232: Some import data scripting commands don’t handle relative paths: now all handle paths relative to the workbook as default.
76609: Maximize energy yield default algorithm for optimisation is not working
76188: Optimiser: swapping cost benefit algorithm is not working correctly
76995: WindFarmer crashes when loading wti file with less than 24 speed bins
72686: Sensor type AmpMeter is not supported in WindFarmer
76719: MERRA 30 mins past the hour data causes FD generation script failure
Data loader bugs
77154: Unable to select measurement types in data loader in project that has too many masts
76626: Overwriting fails with an object reference error
74435: Sensors not filtered properly in Data Loader
74366: Warning that all measurements are set to wind speed in data loader no longer pops up on saving settings
Data cleaner bugs fixed
73753: Selected scatter points remain on scatter plot when selected time range does not contain points
76935: Sync of selection behaviour between clean measurements and correlations doesn’t seem correct
74276: Data cleaner ratio plot filter default should be a low wind speed cut off should of 3 m/s
76825: Crash after add and remove plot tab in data cleaner
69061: Calculated Signals, FrequencyDistribution and TurbulenceIntensityDistribution appear in scatter plot time series selection
Exclusion list group and filter issues fixed:
74014: In edit exclusion, ordering by suspected reason makes the list disappear
76168: Exclusions end up in the wrong group after scrolling in the list
76169: Grouping by reason results in multiple groups with the same reason when exclusions have different source
Demo Features
The following features are experimental and included for the purpose of gathering feedback:
Signal viewer
You can now select signals on the right-hand side of the UI and click view signals to plot them. This early version viewer allows you to plot calculated and measured and different signal type time series together on the same plot.
WindFarmer: Analyst 1.0.4 (2018-10-26)
WindFarmer: Analyst includes some exciting features including the powerful UserLibs and feedback-based improvements particularly in the data cleaner.
User libraries (UserLibs)
UserLibs allow code re-use between many scripts and enable a distribution mechanism for standardised scripting tools. A UserLib is a text file with a .cslib file extension that contains classes and methods useful to more than one script. We suggest that UserLibs are used to
Expose standardised methods to all analysts.
Hide complexity
Allow combination of many complex analysis steps to enable greater process automation
Distribute the responsibility for maintenance
Accelerate and increase the power of tool development through code re-use between scripts.
Enable faster integration of new analysis methods in to the commercial WindFarmer: Analyst codebase.
Using UserLibs
Copy a folder of UserLibs in to special folders on your computer:
Version specific UserLibs and scripts available to WFA 1.0.4: C:\Users\Public\Documents\WindFarmer - Analyst 1.0.4 \Scripts
UserLibs and scripts available to all versions: C:\Users\Public\Documents\WindFarmer - Analyst Common\Scripts
To help with future versioning of scripts for specific WFA releases we recommend that you save scripts in to the versioned local folder. You will then need to get the latest scripts for the latest release. You should remove any scripts with name clashes from your Common folder.
Alternatively import UserLibs directly in to your workbook or create them by selecting the userLib script type then clicking new. This can be useful when developing the UserLibs.
To call a method in a UserLib in the script editor type UserLibs. then view the available methods, namespaces and classes ready for you to use in a similar way to using the WindFarmer scripting Toolbox.
Writing UserLibs
The C# code within the UserLib file is within the UserLibs namespace. You can add further child namespaces, classes and methods within as many files as you see fit.
All UserLibs are compiled when you compile or run a script. Look at the traffic lights in the script editor for feedback on what is throwing errors.
Excel Automation from Scripting
We now include scripting Toolbox methods to allow you to automate excel. A summary of capabilities, taken from the scripting help you can find in the start menu, as below:
// read and write to named ranges in excel or A1:B2 references
ReadRangeFromExcel(string filePath, string workSheetName, string rangeName)

WriteRangeToExcel (string filePath, string workSheetName, string rangeName, List<string>; data)

// Runs a public VBA subroutine in an Excel worksheet
RunExcelSubroutine(string filePath, string workSheetName, string subroutineName)
Switching types of Measurement Sites, Measurements and instruments
After loading time series data through the data loader you may realise that the types are wrong for various parts of the measurement campaign description. You can now correct this!
You can now convert between:
Measurement sites: Masts, Sodars, Lidars, Reference stations,
reanalysis nodes
Switch the type in the table in the Measurement Site Placement task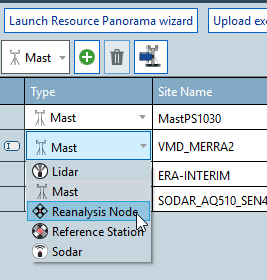
Measurements: Speeds, Directions, Pressure, Temperature, Relative
Humidity, Other, etc…
Switch the types in the table in the Measurement Site Configuration
task. When you change the measurement type any instrument types are
switched to be the default instrument type for the new measurement.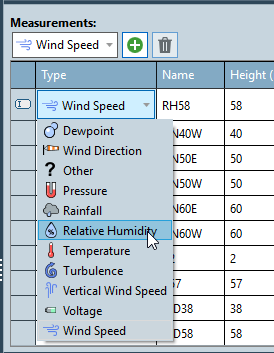
Instruments: Various instrument types are available depending on the measurement type:
Switch the types in the table in the Measurement Site Configuration task after selecting the relevant measurement.
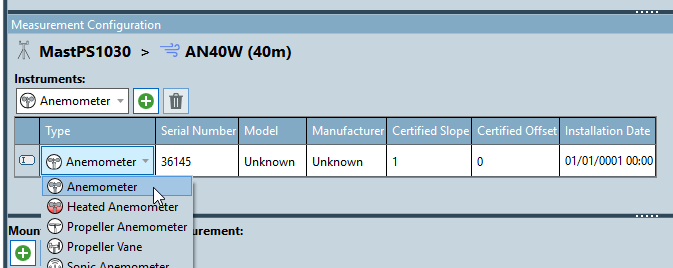
User defined long term adjustments (UI)
We have added a user interface so you can record long term adjustments derived in an external tool.
Add adjustments to selected measurement sites. An adjustment of 1.0 is equivalent to no adjustment. The adjustments can be accessed in scripting and applied to time series or frequency distributions.
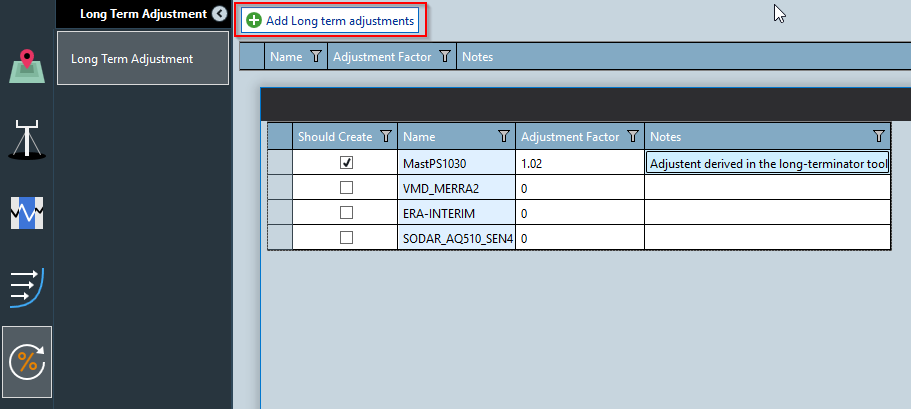
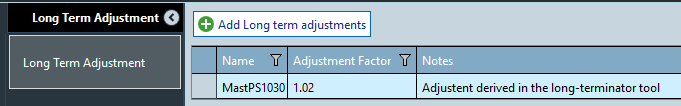
Small improvements and bug fixes
Match multiple series command
We now have added a new scripting command to match multiple time series.
The command takes a list of time series and returns the first in that list matched with the others, for example:
var inputTimeSeriesListToMatch = new List<TimeSeries>()
{
    timeSeriesToMatchWithOthers,
    matchingTimeSeries1,
    matchingTimeSeries2,
    matchingTimeSeries3
};

var myMatchedTimeSeries = Toolbox.MeasurementCampaign.MatchMultipleSeries(
inputTimeSeriesListToMatch );
Data cleaner improvements in response to user testing
Several quick-win changes have been made to the data cleaner:
Better exclusion tool tips
Better point tool tips and cross hairs for quickly understanding time series values
See date times of scatter plot points in tool tip to help you find them on the time series.
Added better labelling to exclusion definition dialogue
Ability to hide legend on data cleaning plots
Default chart theme changed to light theme
Bookmarks now keep axis min/max settings
Check box toolbar label improvements
Data cleaner background in dark theme is now pure black
Other improvements based on feedback
Time series energy calculation documentation in scripting help file
Better mast name validation message
More measurement campaign calculation results exposed in scripting.
Scripting command syntax changes
Some changes have been made to the scripting syntax for consistency:
| Old | New |
|---|---|
| ExportWindTurbulenceIntensityDistribution | ExportTurbulenceIntensityDistribution |
| StoreShearModel | SaveShearModel |
| RemoveResultsTimeSeries | DeleteResultsTimeSeries |
Furthermore, a number of comments in the documentation have been improved.
Bugs fixed
Negative time offsets become positive after saving a workbook
Shear UI: issues with data presented on vertical profile plot
Data cleaner selected range redraw issues on zoom and navigation
Data loader warning that all measurements are set to wind speed in data loader no longer pops up on saving settings
Renaming or deleting a script causes high CPU usage
Shear UI: Matched extrapolated hub height wind speed point is zero m/s for annual shear model
Measurement campaign documentation missing from the scripting help (chm)
Report: Fixed column labelling in ReportWindRose for 16 sectors
Report: Compare frequency distribution axis limits are wrong in cases where the power curve has none-integer binning
WindFarmer: Analyst 1.0.3 (2018-08-10)
Powerful new data cleaning features
Scatter plot point filters
Filter data based on values to “grey out” data that are not relevant from the scatter plots. The filtered points are always shown behind the valid data points:
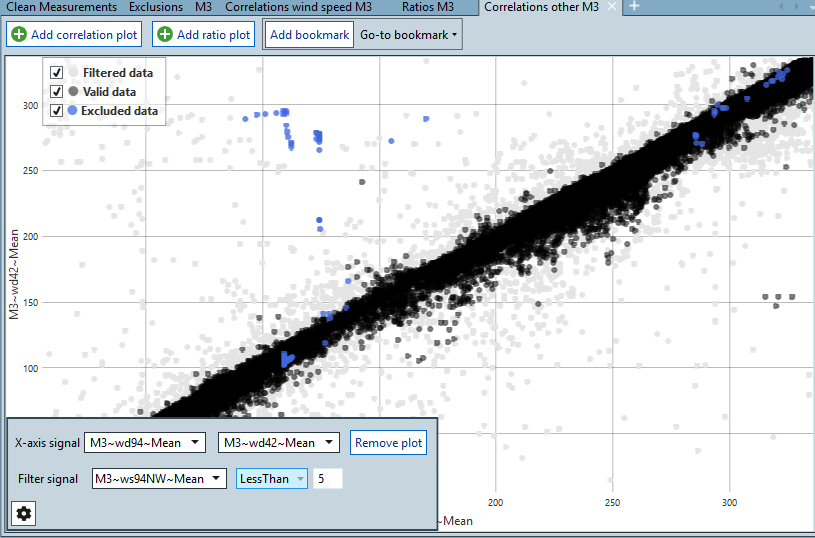
Hide filtered or excluded data from the plots by using the tick boxes in the legend.
Intuitive exclusion editing
Editing the time range
Select a set of exclusions and drag the exclusion edges in the time series chart to rapidly edit the exclusion start and end time.
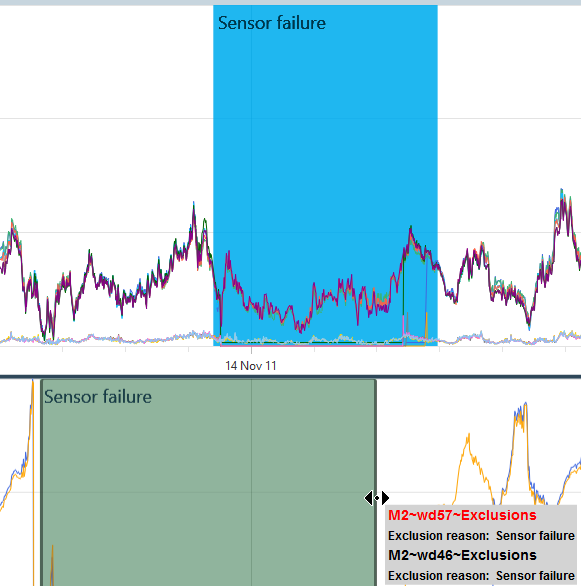
Editing other exclusion properties
Just double click (or right click) on exclusions to bring up an editor to edit all exclusions under your cursor.
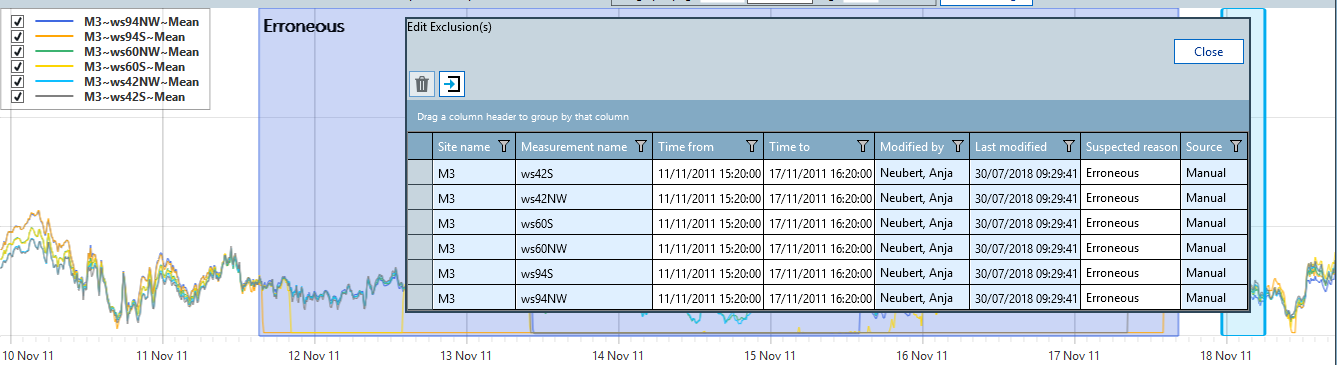
Deleting exclusions
Delete concurrent exclusions simply by selecting the period in the chart and then hitting the “Del” key. Have deleted then accidentally? No problem, just press “Undo”!
You can also delete exclusions from the exclusion edit pop-up.
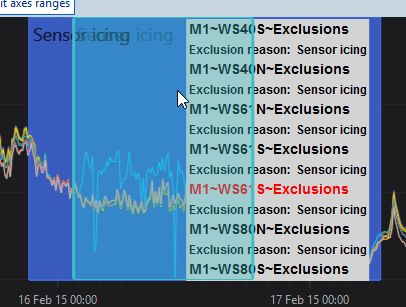
Handling of overlapping exclusions
When exclusions overlap with the same start and end these are selected as a group
If exclusions overlap on a plot with different start and end dates you can select the desired exclusion by clicking on the group multiple times until your desired exclusion(s) are selected. Time range edits or deletes are performed on the selected exclusions.
Exclusion labels
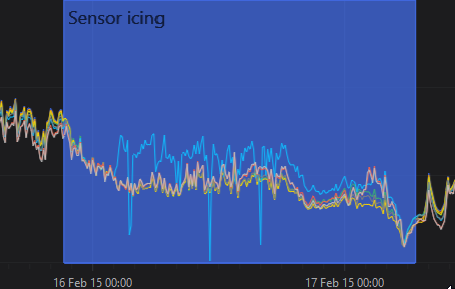
Exclusion reasons can now be optionally shown in the time series charts to see at a glance why data have been excluded.
Data cleaning bookmarks
Add bookmarks to go save your exact cleaning configuration. Select a bookmark to continue cleaning data from the same location in later sessions.
Bookmarks are saved with an image and a note. There is a separate task for reviewing bookmarks and editing notes.
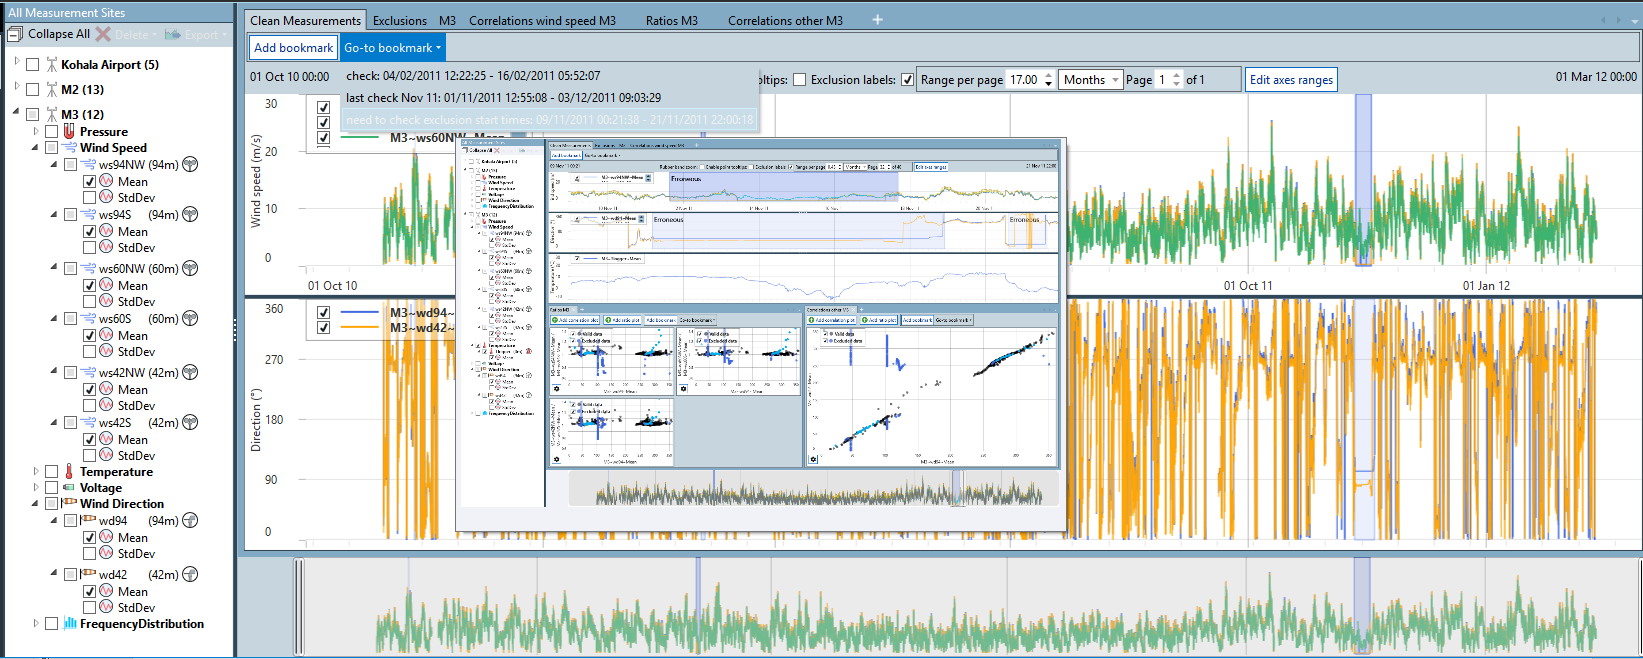
Automatic cleaning workspace setup
To auto-setup a workspace selecting the check box for a mast
All mean wind speeds, directions, temperatures and relative humidity time series are plotted and the following plots are created automatically:
Ratio plot for every set of wind speed measurements at the same height
Correlations for
Wind Speeds for each height down one side of the mast, instruments are correlated based on their orientation
Directions between the top direction sensor and other sensors or between primary and other sensors
Correlation of temperature and relative humidity
Undo-redo
All actions in the Clean Measured Data task have undo-redo functionality.
Improved colour scheme
The colours have been improved to be clearer in both light and dark themes and match clearly selections and exclusions between time series and scatter plots.
Performance optimization
We have made significant optimisations to reduce memory consumption, speed up set-up and speed up exclusion editing.
Fixed bug: sector management rules not applied in time series energy calculation
When using the function “Toolbox.CalculateFlowCases” that runs larger batches of flow cases, wind sector management was not applied correctly. The last non-sector management affected power value for a turbine is repeated through each subsequent time step until the sector management conditions stop being true: you get repeated power values instead of zero power. The impact overall depends on how severe the wind sector management strategy is. Note that this did not affect the function “Toolbox.CalculateFlowCase” that runs only a single flow case at a time.
Time series energy performance: multi-threading
The time series energy calculation run via the scripting command Toolbox.CalculateFlowCases has been optimised to enable multi-threading. This makes the calculation 10 times faster than in 1.0.2.
A test with 220 turbines, 13200 time steps (~3 Months of 10-minute data) now takes 8.25 minutes on our 8-core desktop machine to execute.
Wind shear analysis
Calculate a shear model for a measurement site based on time series inputs at multiple heights and extrapolate a wind speed time series to turbine hub height.
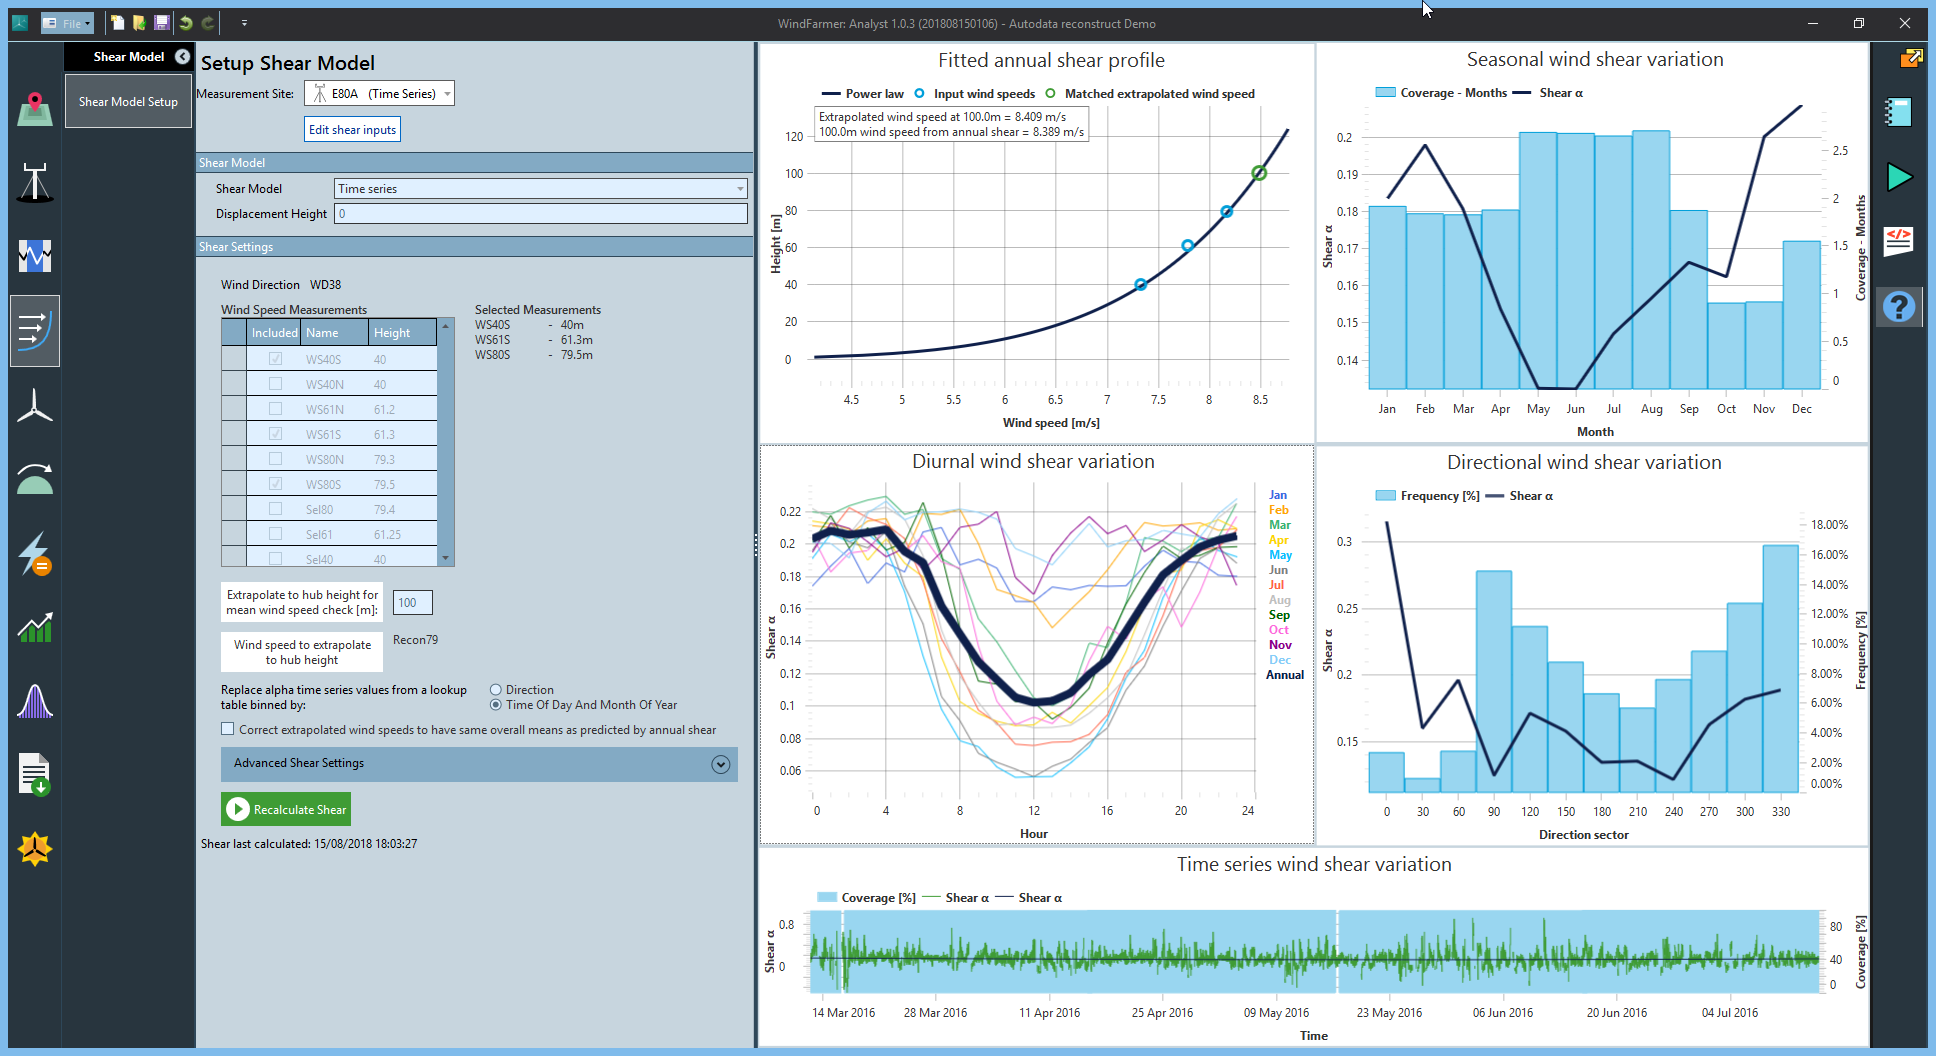
The shear model parameters are calculated from wind speed measurements at multiple heights, using a least-squares fitting method.
When using the power law model, the shear parameter α is calculated from:
$$\alpha = \frac{N\sum_{i}^{}{\ln\left( z_{i} - d \right)\ln\left( u_{i} \right)} - \sum_{i}^{}{\ln\left( z_{i} - d \right)\sum_{i}^{}{\ln\left( u_{i} \right)}}}{N\sum_{i}^{}\left( \ln\left( z_{i} - d \right) \right)^{2} - \left( \sum_{i}^{}{\ln\left( z_{i} - d \right)} \right)^{2}}$$
Where
zi – measurement height i in m
d – displacement height in m
ui – wind speed at height i in m/s
N – number of measurement heights
When using the log law model, the shear parameter z0 is calculated from:
$$\mathrm{\text{slope}} = \ \frac{N\sum_{i}^{}{u_{i}*ln\left( z_{i} - d \right)} - \ \sum_{i}^{}{\ln\left( z_{i} - d \right)\sum_{i}^{}u_{i}}}{N\sum_{i}^{}{\ln\left( z_{i} - d \right)} - \sum_{i}^{}{\ln\left( z_{i} - d \right)\sum_{i}^{}u_{i}}}$$
$$\mathrm{\text{offset}} = \frac{1}{N}\ \left( \sum_{i}^{}u_{i} - slope*\sum_{i}^{}{\ln\left( z_{i} - d \right)} \right)$$
$$z_{0} = exp\left( - \frac{\mathrm{\text{offset}}}{\mathrm{\text{slope}}} \right)$$
Annual shear
The annual shear model is a simple shear model derived by fitting the shear profile through the annual wind speeds at all heights that are selected as inputs.
The result is a single annual shear parameter, either α (when using the power law) or z0 (when using the log law). When extrapolating a time series to hub height using the annual shear model the same speedup factor is applied to each time series record.
To use the annual shear model select the Annual option when editing the shear model setup:
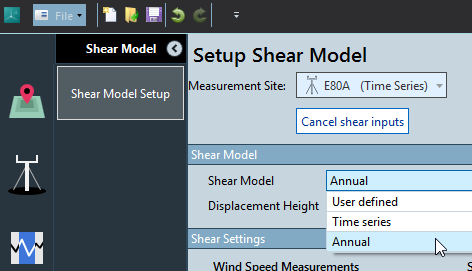
More details:
Prior to calculating the annual wind speeds each input wind speed time series is matched with the others.
The annual wind speed is either the Mean of monthly means if there is data in each month of the year or the arithmetic mean if not.
Time series shear model
The time series shear model for a measurement site can be calculated from the user interface or via the scripting method CalculateTimeSeriesShear.
The time series shear model consists of a time series of power law α values and a lookup table to fill any gaps in the time series when the shear model is used in the extrapolation to hub height.
Lookup table settings
![]()
When you extrapolate to hub height missing time series shear-alpha values are replaced by those from a lookup table. The lookup table can be binned in 2 ways. It is formed by binning and averaging of the alpha time series. You can review the directional and diurnal shear variation plots in the UI or report generated from a script to help choose the most appropriate shear binning mechanism.
Extrapolating to hub height
Use the scripting method ExtrapolateWindSpeedTimeSeriesToHubHeight to produce a wind speed time series at hub height based on your calculated or user defined shear model. This time series can then be used to create a frequency distribution (scripting only) to use as the input in the flow model.
Note that the shear model you calculate in the UI is a property on the MeasurementSite in scripting.
Hub height wind speed check
The hub height wind speed check allows you to compare the hub height wind speed predicted by the time series shear model against the profile predicted by the Annual Shear Model.
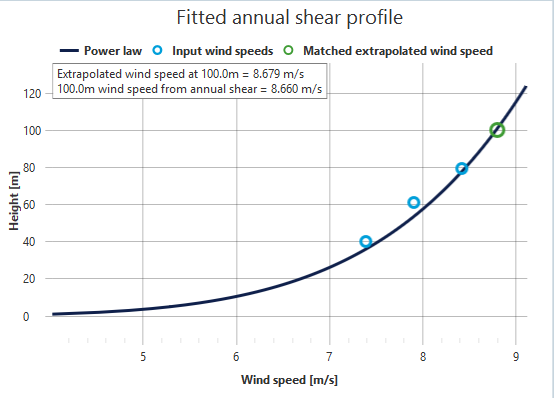
Select a “hub height” and a wind speed time series to extrapolate.
The Green point represents the annual wind speed of the extrapolated wind speed time series. The extrapolated time series is matched with the input time series (the blue points) so you are comparing annual wind speeds for the same time periods.
Additional information is provided in the text box. This indicates the hub height wind speeds (not matched) predicted by the shear model and the annual shear model.
The power or log law profile (the line) represents the fit of the model. The profile is generated by extrapolating the annual wind speed of the uppermost input time series to many heights.

If you see large discrepancies between the hub height wind speeds predicted by the time series model and the annual shear model you may choose to apply the optional annual shear adjustment factor described below:
Optional adjustment of extrapolated wind speeds to match annual shear model prediction
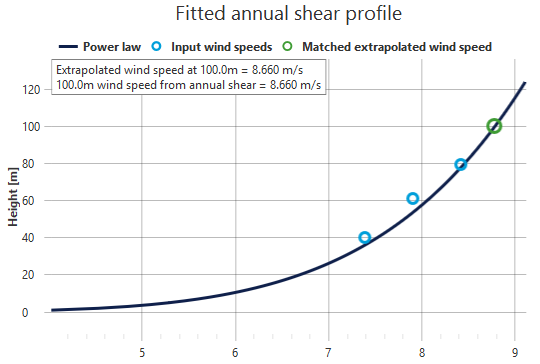
When running the time series shear model you will notice a setting:
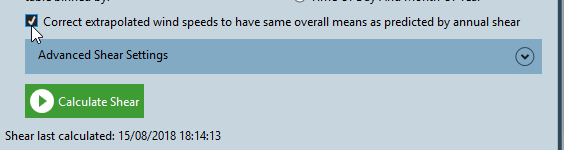
This will apply an adjustment factor to the extrapolated wind speed time series such that the annual wind speed of the extrapolated time series is the same as that predicted by the (more simple) annual shear model. This allows preservation of the time series shear variation yet control over the mean shear.
In the annual shear profile plot with the green extrapolated wind speed point will lie on the vertical profile predicted by the annual shear model.
Advanced time series shear model settings
The following advanced shear settings are available, all have sensible defaults:
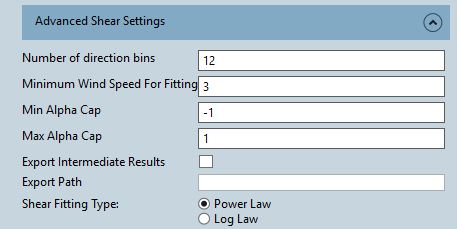
| Number of direction bins | Effects the directional lookup table (should you use this) and the directional wind shear variation plot. |
| Minimum wind speed for fitting | When the highest height wind speed measurement speed is below this value no time series alpha value is calculated: anemometer accuracy at low wind speeds degrades. |
| Min alpha cap / Max alpha cap | To guard against erroneous extreme alpha values causing unrealistic hub height wind speed predictions and hence bias you can cap the min and max time series alpha value. |
| Export intermediate results | For validation purposes this exports the raw and capped alpha time series and lookup tables. |
| Shear fitting type | This is used for the annual shear adjustment, should you wish to apply it. The default is power law, but you can also derive corrections from log‑law annual shear. |
Support for different WTI file formats
WindFarmer: Analyst now supports all wti file format variations. These include Windographer and WindFarmer 5 exported and versions of these created with different regional settings.
Scripted energy calculation performance improvement
Energy calculations have been made faster for many workbooks by reducing memory consumption!
The improvement is much greater for workbooks with lots of contour data and is generally most noticeable for smaller workbooks and faster energy calculations: some calculation start-up overheads have been trimmed.
An average 17% improvement was achieved across our test data set plotted below.
[CHART]
We achieved this by massively reducing the memory footprint of vector contour data. This has performance benefits for many actions in WindFarmer in the UI too. This greatly reduced the time taken to create a “Scenario” in scripting (from 17 minutes to 12 seconds in one case). Now additional overheads to using scripting for energy calculations are minimal. (Note, Scenarios hold the energy calculation results and a copy of the inputs, see the scripting documentation for more information)
Measurement Campaign scripting enhancements
Generate frequency distributions and turbulence distributions for other than 12 sectors
FD and WTI generation is now possible for other than 12 sectors. When not specified, a default of 12 sectors is used.
Access to more measurement campaign data and calculation results in scripting
Frequency distribution comparison indicative energy content and mean wind speed from each frequency distribution compared by CompareFrequencyDistribution
Mounting arrangements are now accessible in scripting. For example this enables automation of parallel measurement combination through access to the boom orientation to define the exclusion zone centres.
Time series saving We now allow you to define the height of a calculated time series when you save it in to the workbook from scripting.
Review calculated signals saved on a measurement site. The MeasurementSite now includes a collection of calculated signals
Uncertainty is now returned by CalculateUncertainty so you can use this to prioritise data reconstruction options.
Number of valid records is now available on a time series which can be useful for accessing the benefit of data reconstruction options.
Reporting
Custom text or tables to can be added to the Word report with styles defined by name:
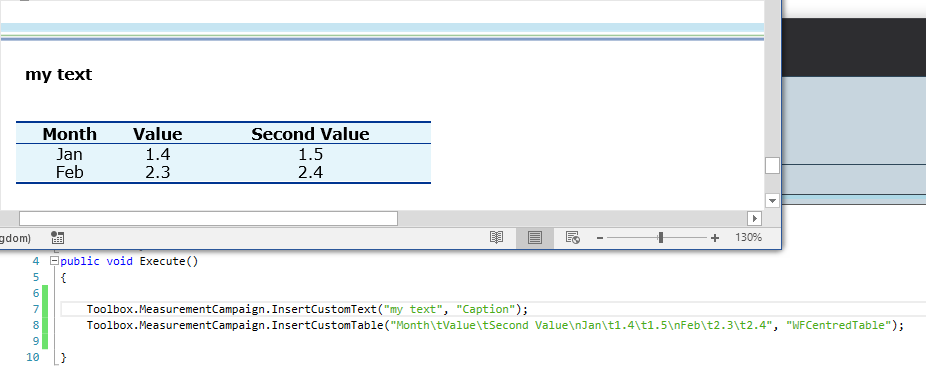
It is now possible to suppress opening the Word after report generation by adding an optional Boolean in the FlushReport function. This can increase performance of your script when you are generating multiple reports from a script.

Other improvements
Site setup wizard usability improvements
You can now check the site location in Google Earth and more information tips are included to help you through the process
Better measurement campaign configuration UI
The layout of the measurement campaign configuration UI has been changed to work better for narrow monitors and have more logical hierarchy.
Bugs fixed
Default World Street Map download sometimes did not get any data: Now uses resolution where data are available for selected location
Issues using online map data download in settings with a proxy
Calculation time increased when turbines grouped in multiple wind farms
When importing wind farms from other workbooks, it was always necessary to run the auto-generation of initiation regions. Now the turbine-mast assignments are set based on the wind climate data in the imported farm.
Word report generation fails when there are wind farms without turbines
Data loader assumes .cal files are invalid
Bottom plot on single-signal time series plot is squashed and unreadable
Crash in create turbulence distribution with MonthYear binning rules
Issues plotting time series data of type other in the cleaner
Scripting try catch stack trace line is reported 4 lines after the actual error
WindFarmer: Analyst 1.0.2 (2018-05-11)
WindFarmer: Analyst 1.0.2 includes bug fixes and extra scripting documentation compared to WFA 1.0.0. Please also see the release note below for WFA 1.0
Summary:
Major energy calculation performance improvement for larger wind farms
Improved scripting documentation
Customer portal with documentation, Knowledge base (FAQs) and installers
Bug fixes
Major energy calculation performance improved for larger wind farms
The performance improvement scales roughly mainly with the number of turbines, although some small farms see big improvements too. You will also see larger performance improvements for projects that have greater numbers of masts and wind farms.
[CHART]
The modified park wake model is now also faster than it was in WindFarmer 5.3 which is positive news for layout optimisation in WindFarmer: Analyst.
Wind analysis scripting documentation and code snippets installed
Scripting help is available via the start menu for each version of WFA. This is a searchable and replaces the old code-snippets word document so you can copy example code from this help tool and then modify this for your needs.

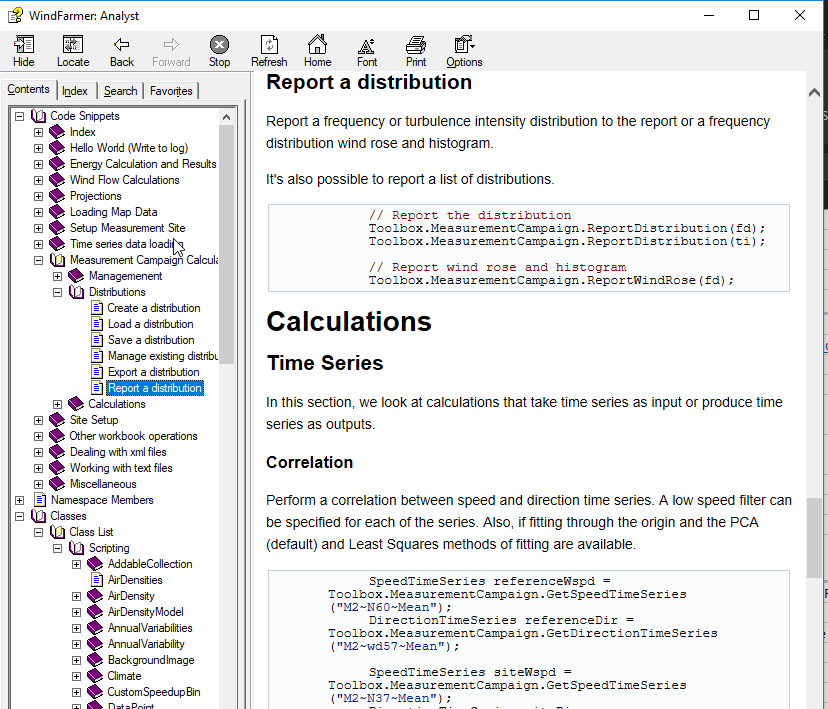
Bugs fixed
Park wake model slower than eddy viscosity wake model.
Minor energy results bug causing differences in the last decimal place in energy for some turbines. This was caused by rounding errors when importing and storing tab files.
Severe performance degradation in WFA 1.0.0 time series energy calculation has been improved.
WindFarmer: Analyst 1.0 (2018-02-28)
WindFarmer: Analyst 1.0 is the first commercial release of WindFarmer: Analyst. It incorporates DNV’s and internal wind analysis tool, a time series shear calculation based on the DNV methodology and a basic long term adjustment calculation to complete the core energy production assessment workflow.
Wind Shear Analysis
A wind shear research project in 2016 compared wind shear modelling methodologies at more than 200 tall masts. This demonstrated that the DNV GL time series shear methodology was the best method for predicting a time series of hub height wind speeds and minimizing the error in energy prediction due to wind shear. This methodology has been implemented in WindFarmer: Analyst.
Calculate a power law based wind shear model comprising of an alpha time series and a lookup-table to replace missing values in the time series.
Visualize the and report the variations in wind shear
Extrapolate wind speeds to hub height
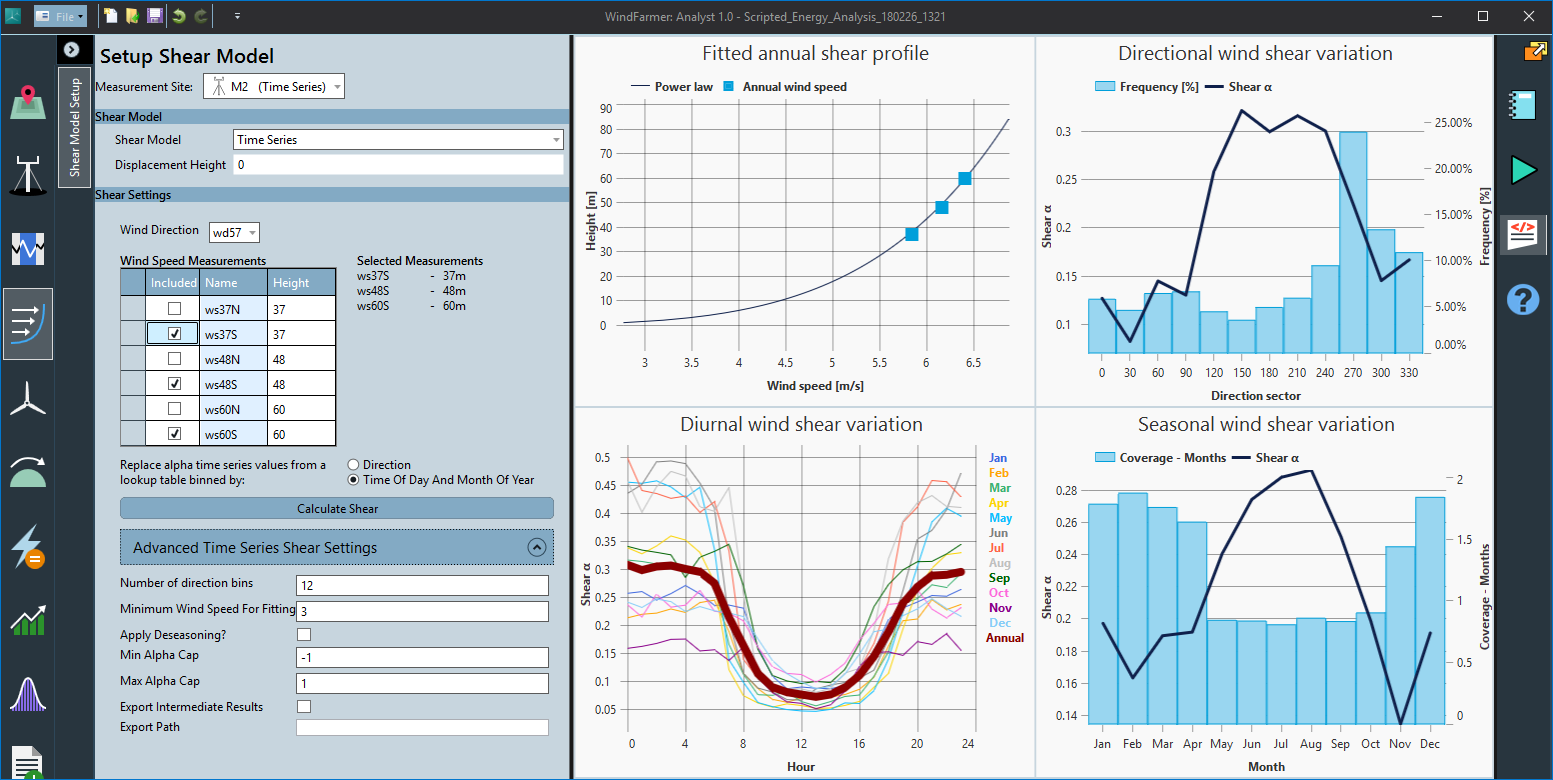
Shear feature summary (UI vs Script)
| UI | Script |
|---|---|
Define the shear model for each measurement site
|
available |
Analyse time series (power law) shear model
|
Analyse time series shear |
Visualise wind shear:
|
Report visualisations and tabulated wind shear results |
| Extrapolate wind speed time series to hub height using a time series shear model | |
Store script analysed time series shear model in project for a measurement site and review this in the UI. Read shear model analysed in the UI for use in extrapolation. |
Basic Long term adjustment
We have implemented the ability to calculate a long‑term adjustment for site wind speeds from a reference wind speed data set based on an all-data N‑daily resampled correlation.
Configurable settings include the ability to force the correlation through the origin or not, the resampling period in days, the Minimum coverage for accepting a point in a correlation and the minimum coverage ratio for splicing synthetic site data in to the site data time series to calculate the long term mean wind speed.
The long-term adjustment scale factor can be applied to scale a time series (SpeedUpSeries) or frequency distribution (SpeedUpFrequencyDistribution or ScaleFrequencyDistributionToTargetSpeed) to long term wind speed expectations.
High performance wind analysis:
Rapid data ingest. Huge gains have been achieved by utilizing our highly-optimized time series library for data loading. We can now load very large volumes of data without hitting memory limits.
Highly compressed time series storage: no project size limits. The true limit is defined by the RAM on your computer as the full project is loaded in to memory to compress it when saving. We now store time series data in a compressed binary time series storage format.
Application memory limits removed. WFA is an 64 bit process you should not get out-of-memory errors due to 32 Bit memory limits being hit when processing large data sets.
New data cleaner
Multi-window data cleaning designed to work with all your monitors
Undo-redo of exclusion edits
Graphics card acceleration for smooth interactions (note the intel graphics cards are not supported – performance is still great but you must turn off hardware acceleration).
C# scripted wind analysis:
Using a real programming language makes WFA very powerful:
Compile scripts before running to reduce debugging time
Write and re-use methods instead of using code snippets
Apply logic and use the data model to automate standard workflows.
Chain together measurement campaign methods with automatable data loading, flow and energy calculations…
Auto-generate a measurement campaign history report
Store calculated time series and frequency distributions in the workbook
No need to export files and re-load to save reconstructed data on a mast. Load and manipulate previously saved time series or FDs in later scripts.