Yield Results
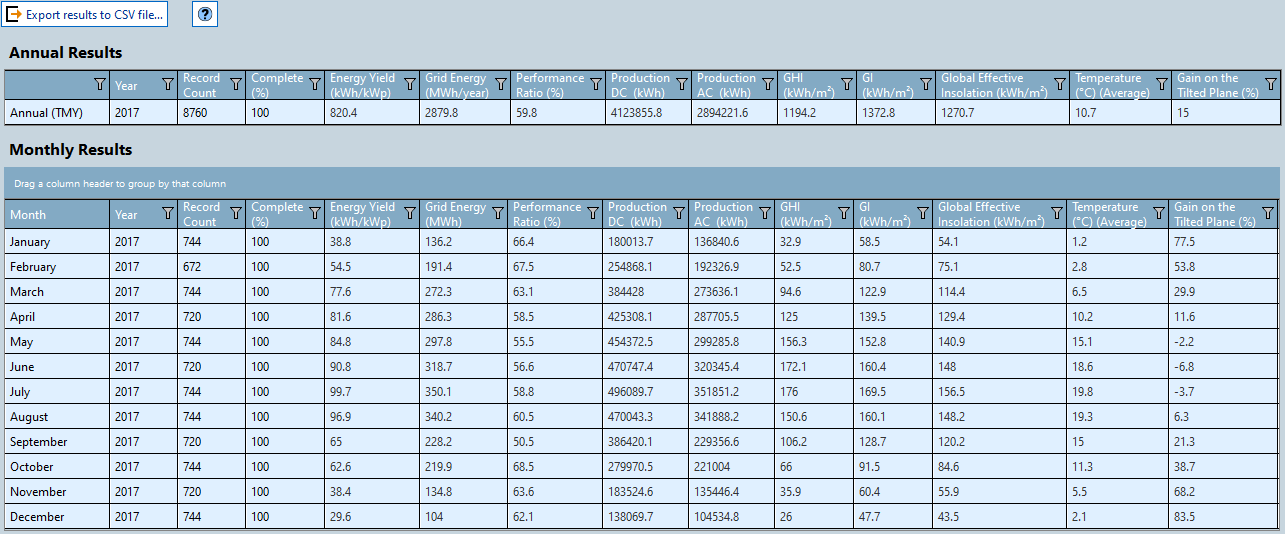
Once the energy yield calculation has completed the annual and monthly yield results are available. There are tables for annual and monthly values. The results are not stored in the workbook, so you would need to rerun the calculation to see the results when you reopen an existing workbook.
You can export these results to a *.csv file using the button in the top-left of the screen.
 (click to enlarge)
The columns in the tables are:
| Column | Description |
|---|---|
| Year | The year during which results were aggregated. Multiple years will be shown if the input data span more than one year. |
| Record Count | The number of timesteps that were aggregated during the year or month. If there are missing data then the record count will not include those timesteps. |
| Complete (%) | The percentage of timesteps that were aggregated during the year or month. If there are missing data then this will be less than 100%. |
| Energy Yield (kWh/kWp) | Defined as the ratio of net energy input to the grid to the total peak DC capacity at STC. The resulting units can be reduced to hours, indicating the number of hours that the plant would need to output at the rated DC output to produce the simulated production over the month or year. It is more commonly given as units of energy to peak power, i.e. "kWh / kWp" (see Performance Ratio). The "Energy Yield" is useful to compare different sites because it is normalized to the DC capacity. |
| Grid Energy (MWh) | The net energy input to the grid at the point of interconnect including all losses. |
| Performance Ratio (%) | The ratio of the "Energy Yield" to the irradiance in the plane of array normalized by the reference irradiance if 1000 W/m² (see Performance Ratio). The "Performance Ratio" is also useful to compare different sites and demonstrates how well a site utilized the available irradiance. It's a better metric than capacity factor because PV systems don't operate for 8760 hours a year. Performance ratio only considers the effective number of 1-sun hours, which is less than the total number of hours in a year or month. E.g. there are 8760 hours in a year, but effectively only 2000 or more hours at 1-sun (or 1000 W/m²). |
| Bifacial Performance Ratio (%) | It is a similar ratio than the Performance Ratio, but incorporates a bifacial irradiance factor to correct the irradiance terms and include the effective irradiance reaching a bifacial system from both the front and rear-side collectively (see Performance Ratio). This property will only appear for bifacial systems whose results are from the API cloud calculation. |
| Production DC (kWh) | The total inverter input; also known as the array virtual energy at MPP (see Array Virtual Energy at MPP). |
| Production AC (kWh) | The total inverter output. It does not include AC Collection or transformer losses. |
| GHI (kWh/m²) | Total global insolation in the horizontal plane (see Input Data). |
| GI (kWh/m²) | Total global insolation in the plane of the array (POA). This does not include horizon, shading, soiling, IAM, spectral, or bifacial effects (see Input Data). |
| Global Effective Insolation (kWh/m²) | Net insolation on front and back surfaces including all losses and the effect of bifacial (see Inputs for Module Performance Model, Bifacial, and Spectral Effect). |
| Temperature (°C) | The average ambient temperature (see Aggregation). |
| Gain on the Tilted Plane (%) | The gain in the total global insolation in the plane of the array compared to the horizontal plane. |